


See the Levels you won't find anywhere else.
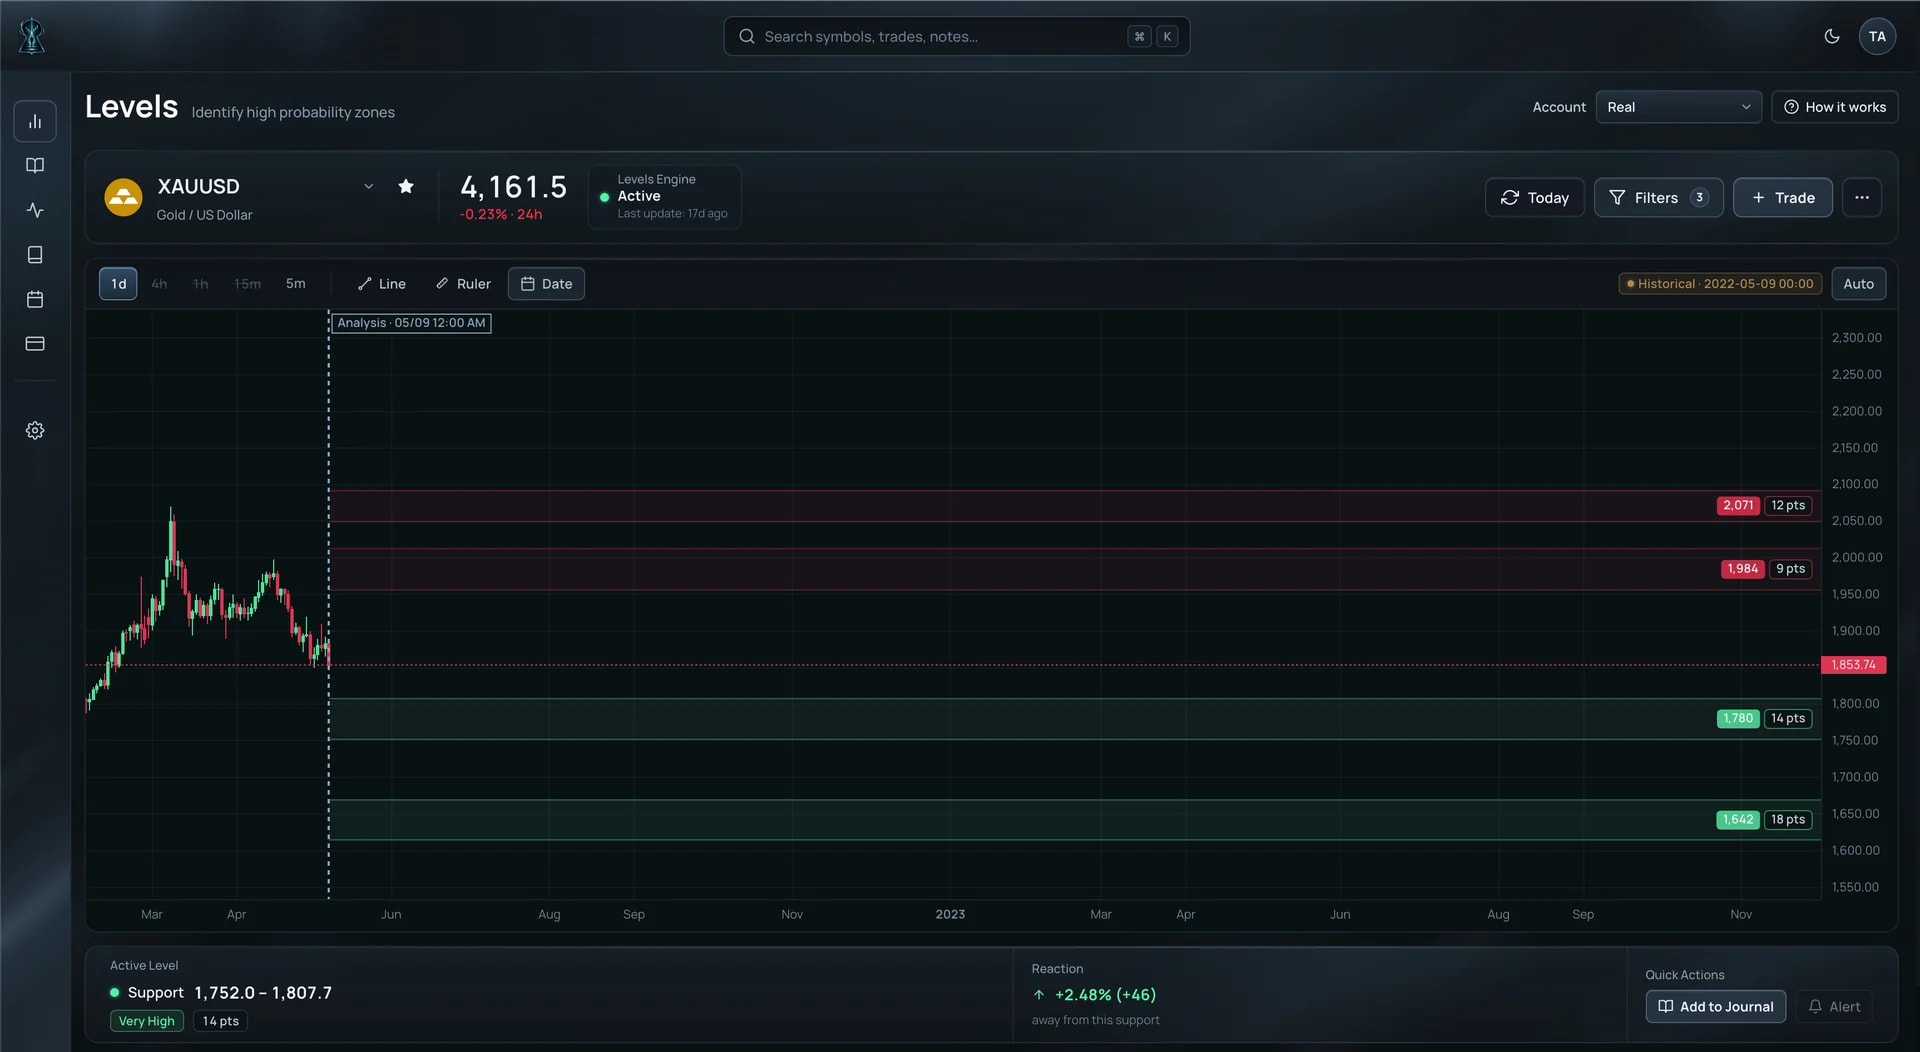
Secret Levels reveals potential support, resistance and turning zones before price reaches them. Each Level comes with a defined price range and a strength score, so you know where to watch and which zones are stronger.
Every Level gives you two things
A price zone and a strength score.
Each zone defines an area where a reaction may begin. Sometimes price reacts from the very edge. Other times it moves deeper into the zone, takes part of the liquidity inside it and then turns back.
The higher the score, the stronger the zone.
Trade the reaction
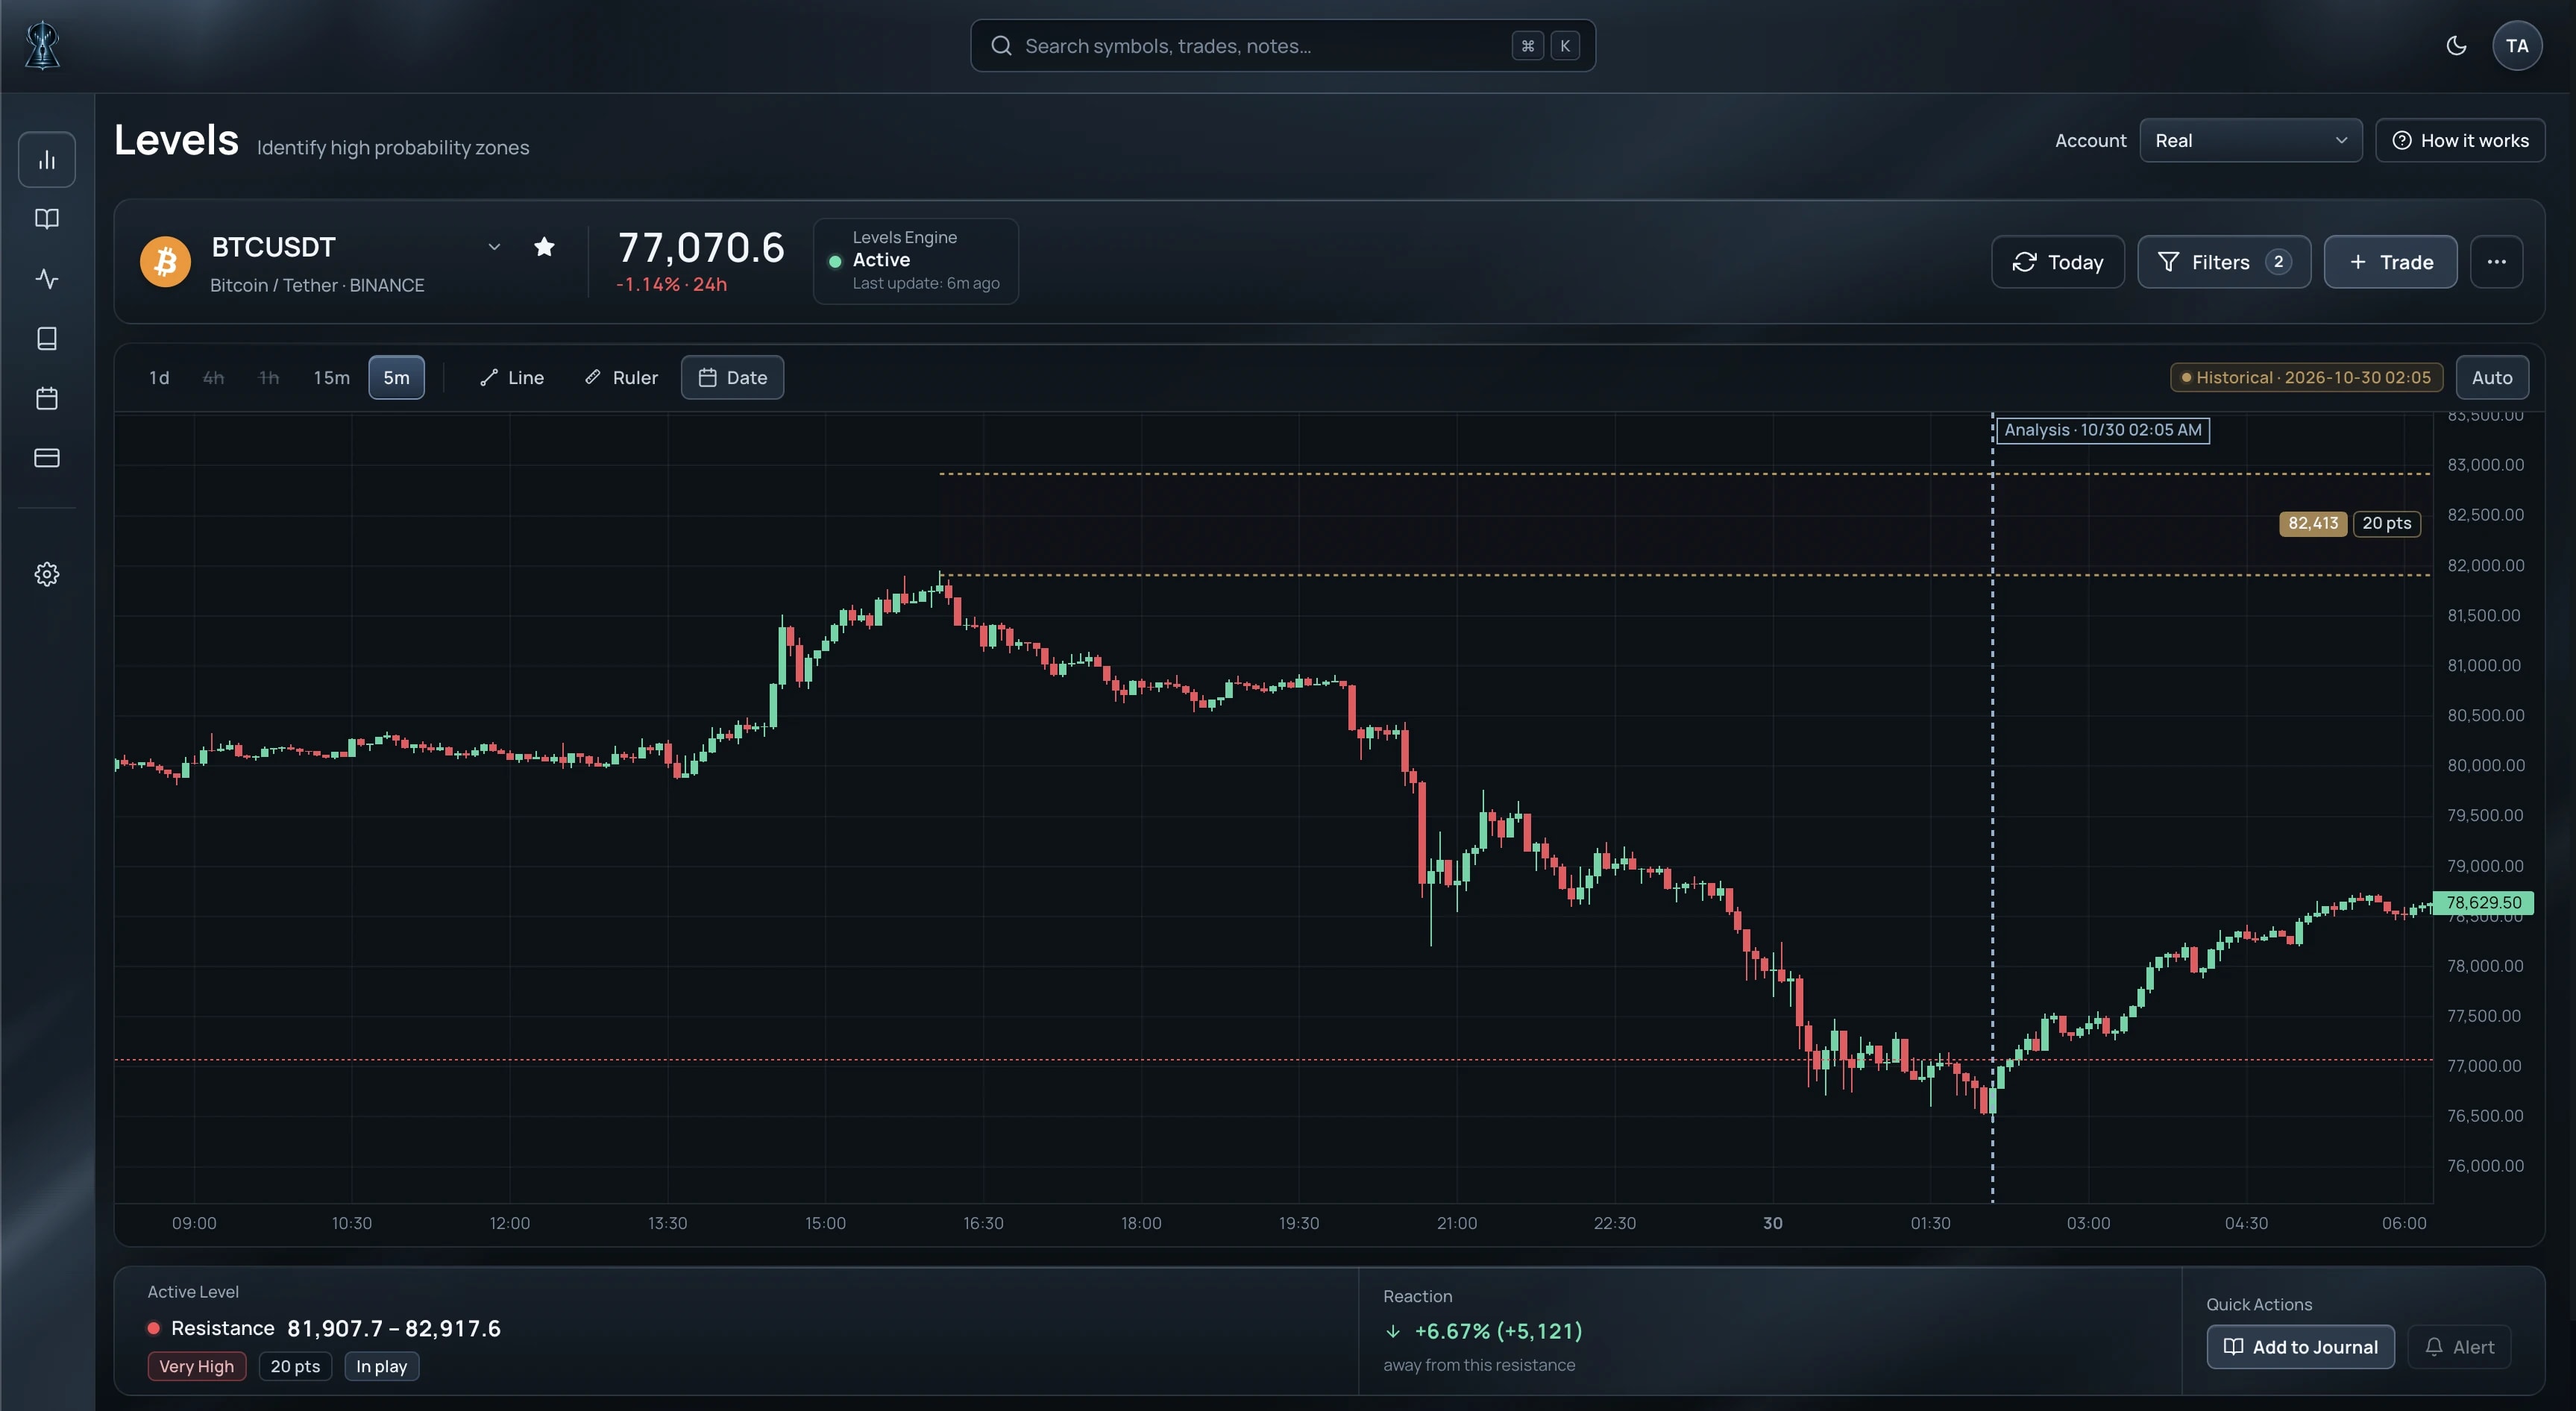
Our preferred approach is to let price come to the Level and wait for the rejection.
When price touches or enters the zone and then closes back outside, the reaction can be used to structure the trade.
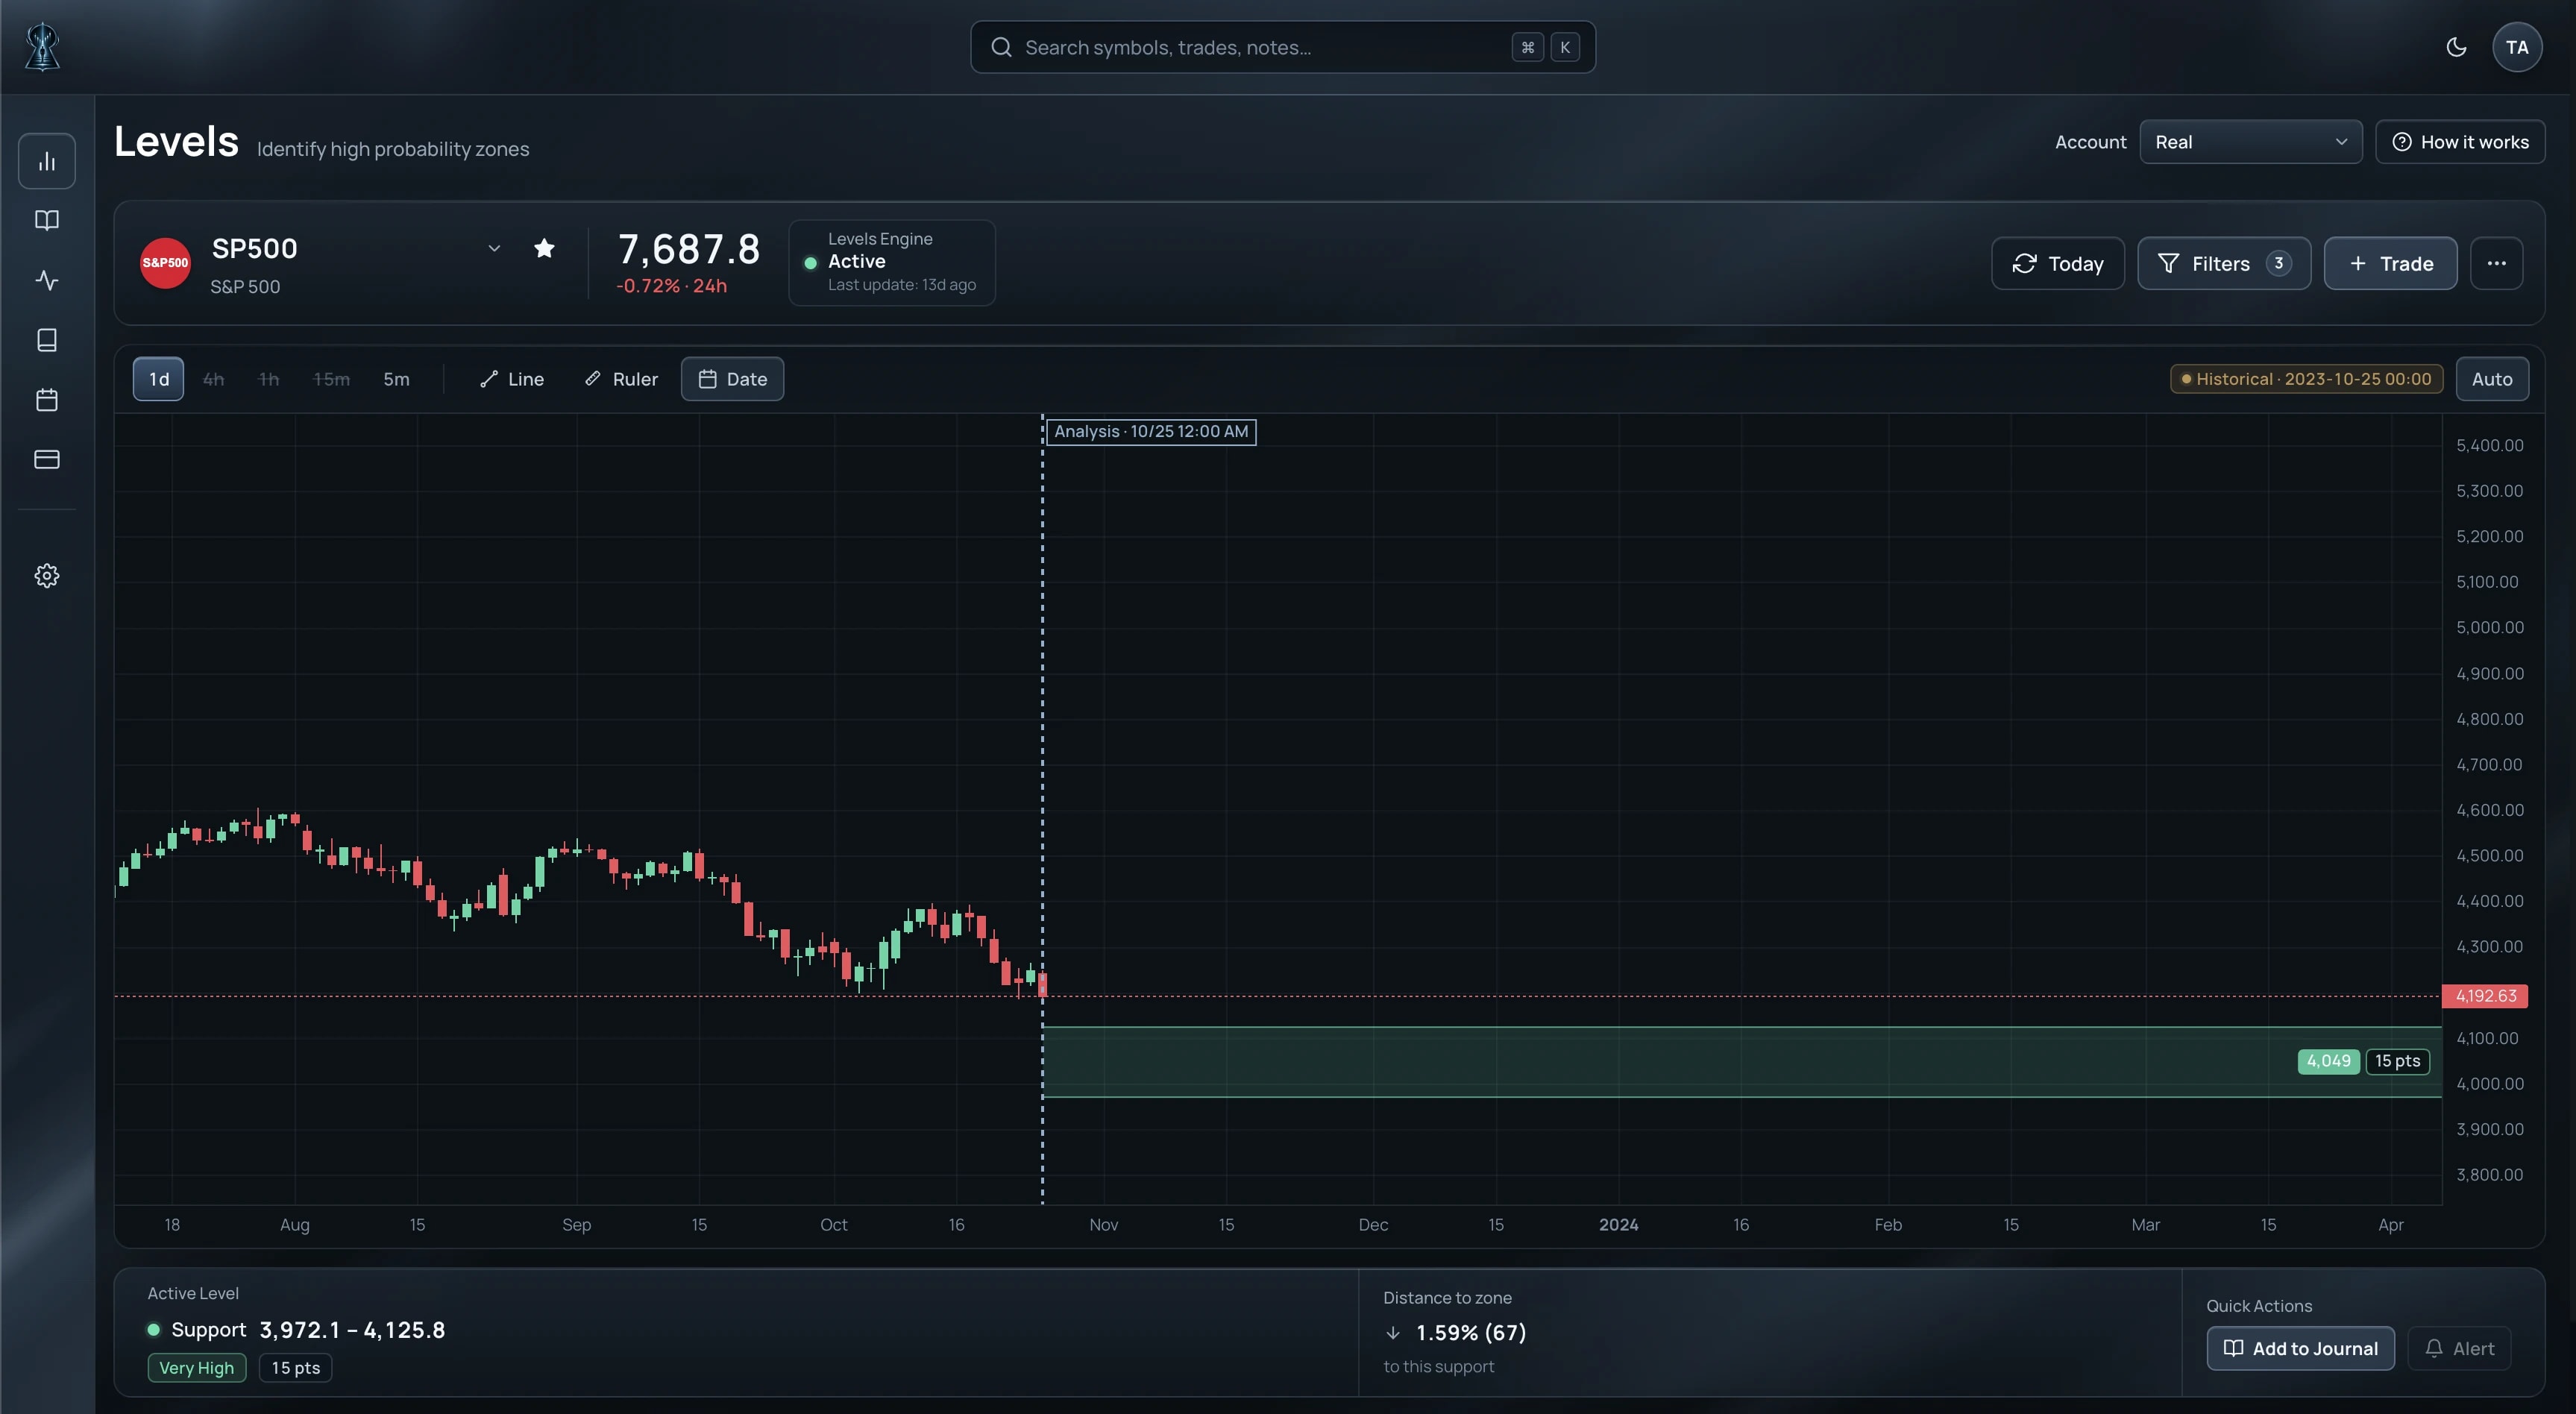
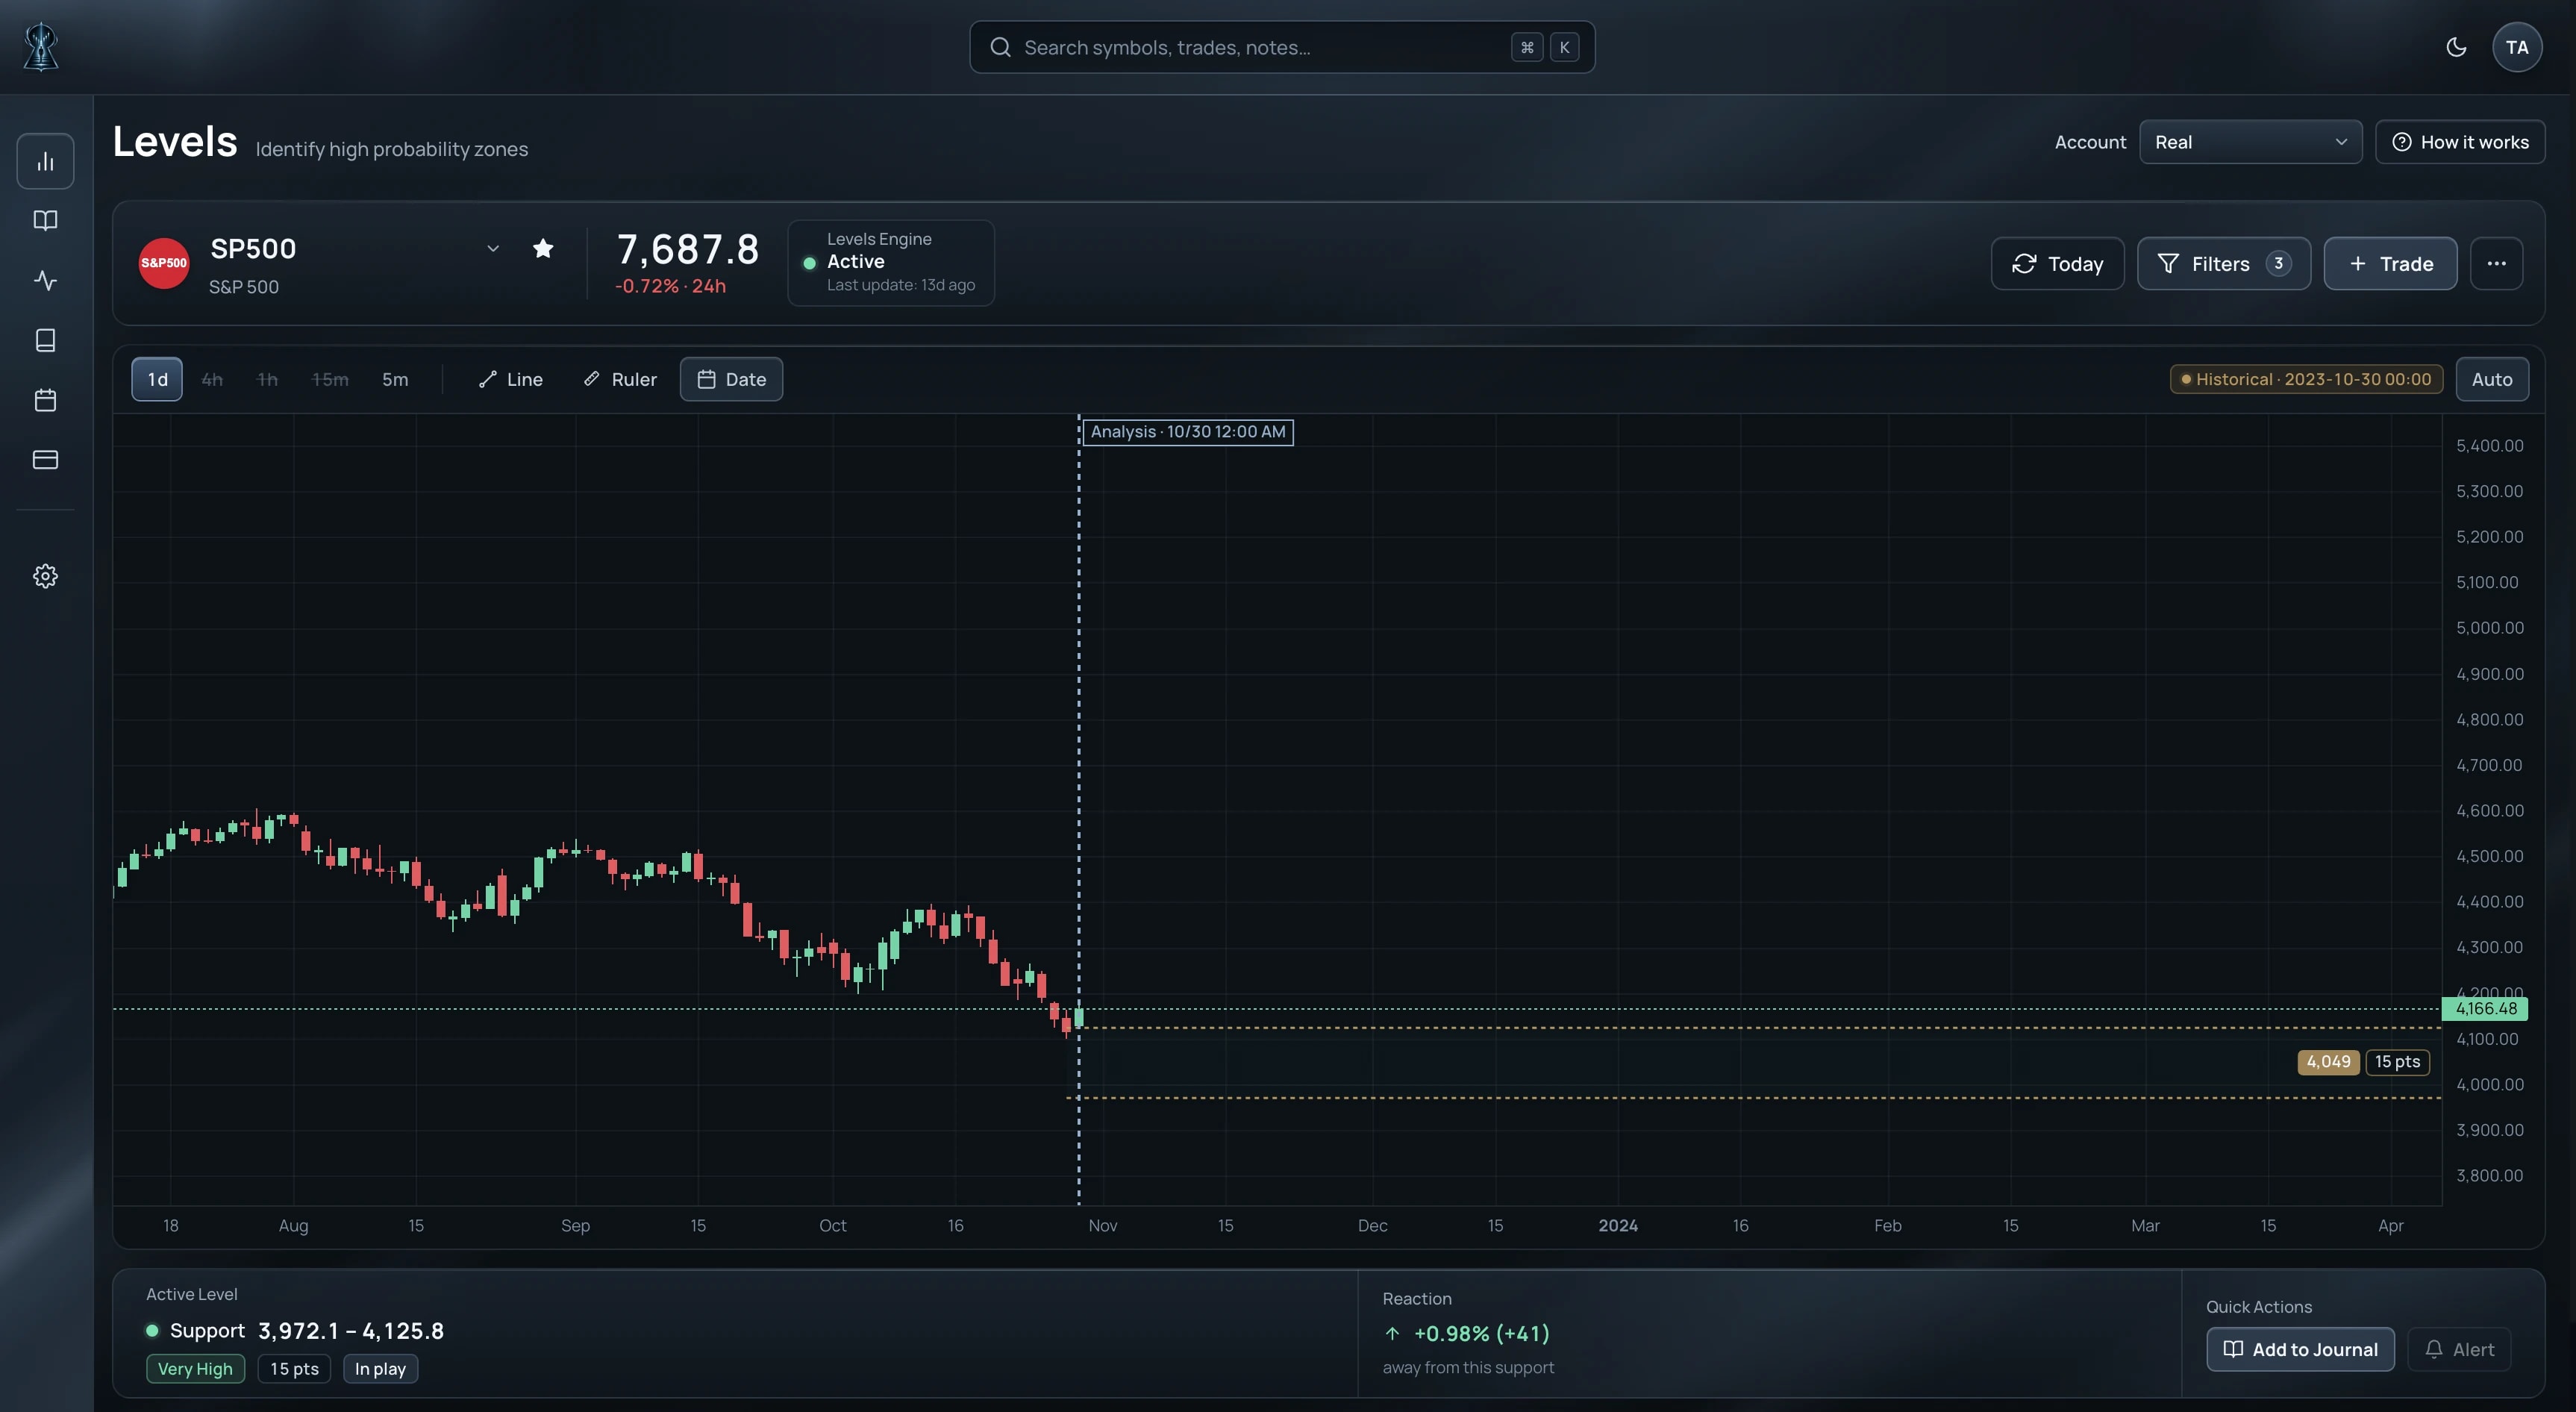
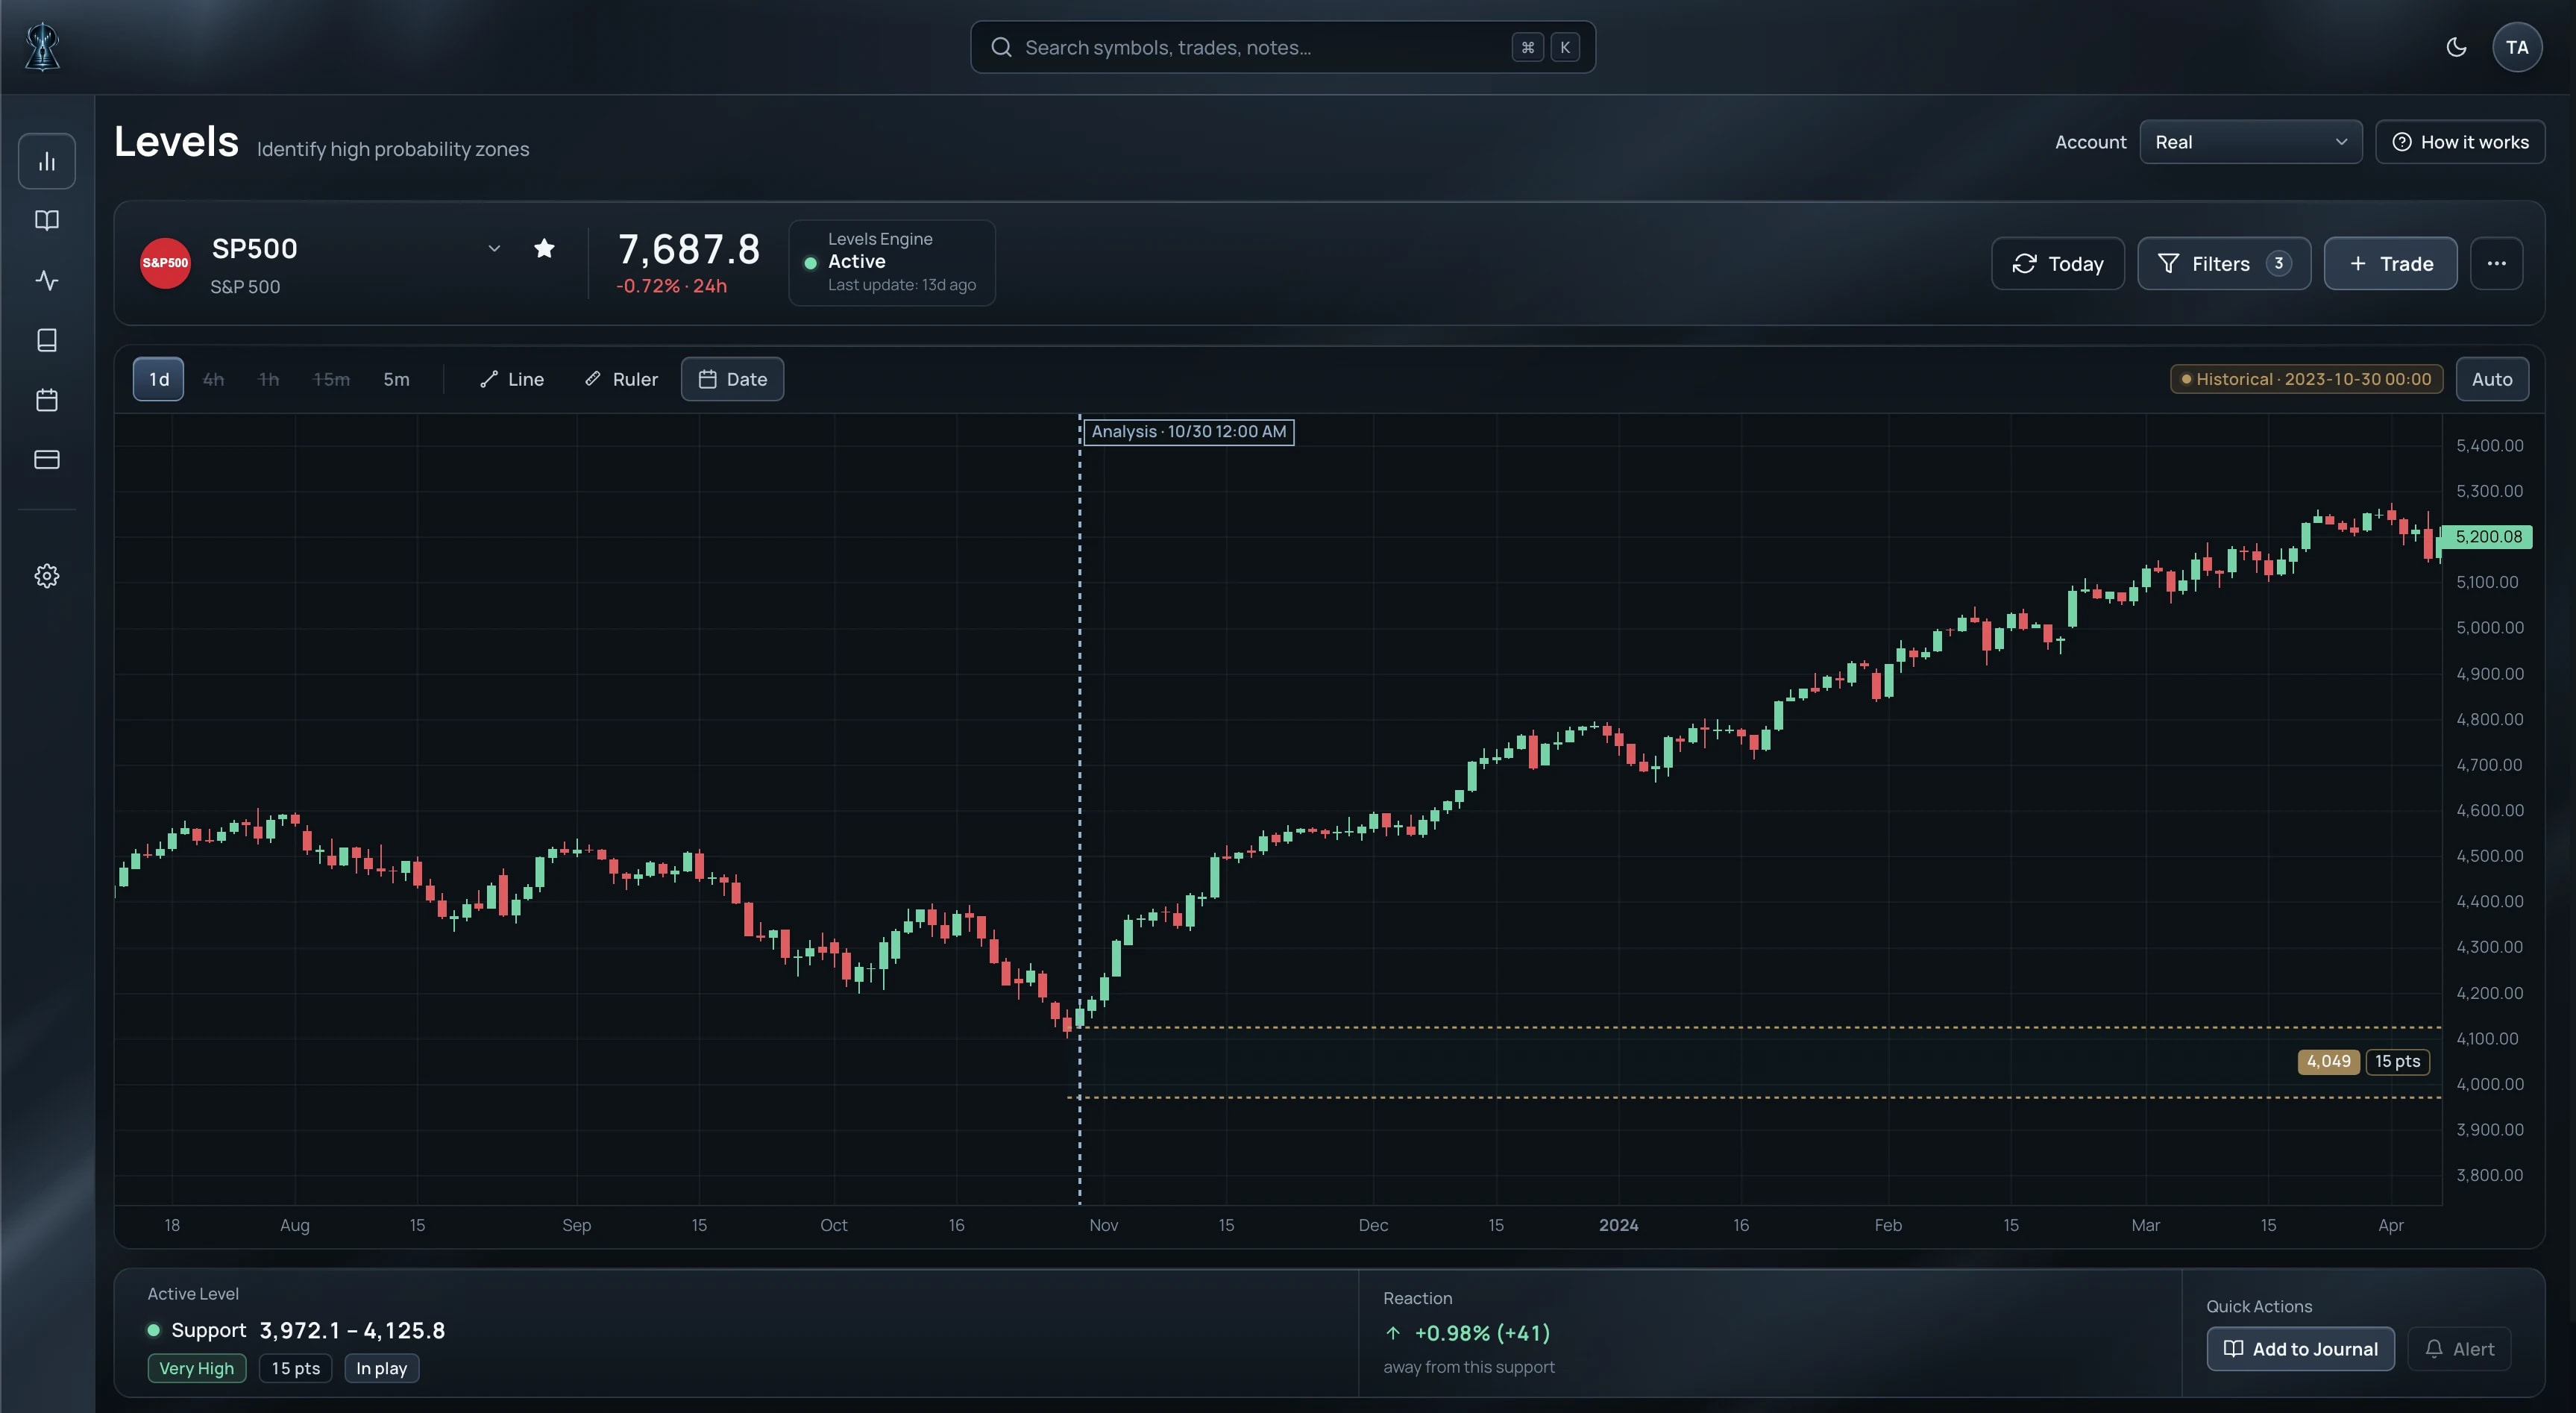
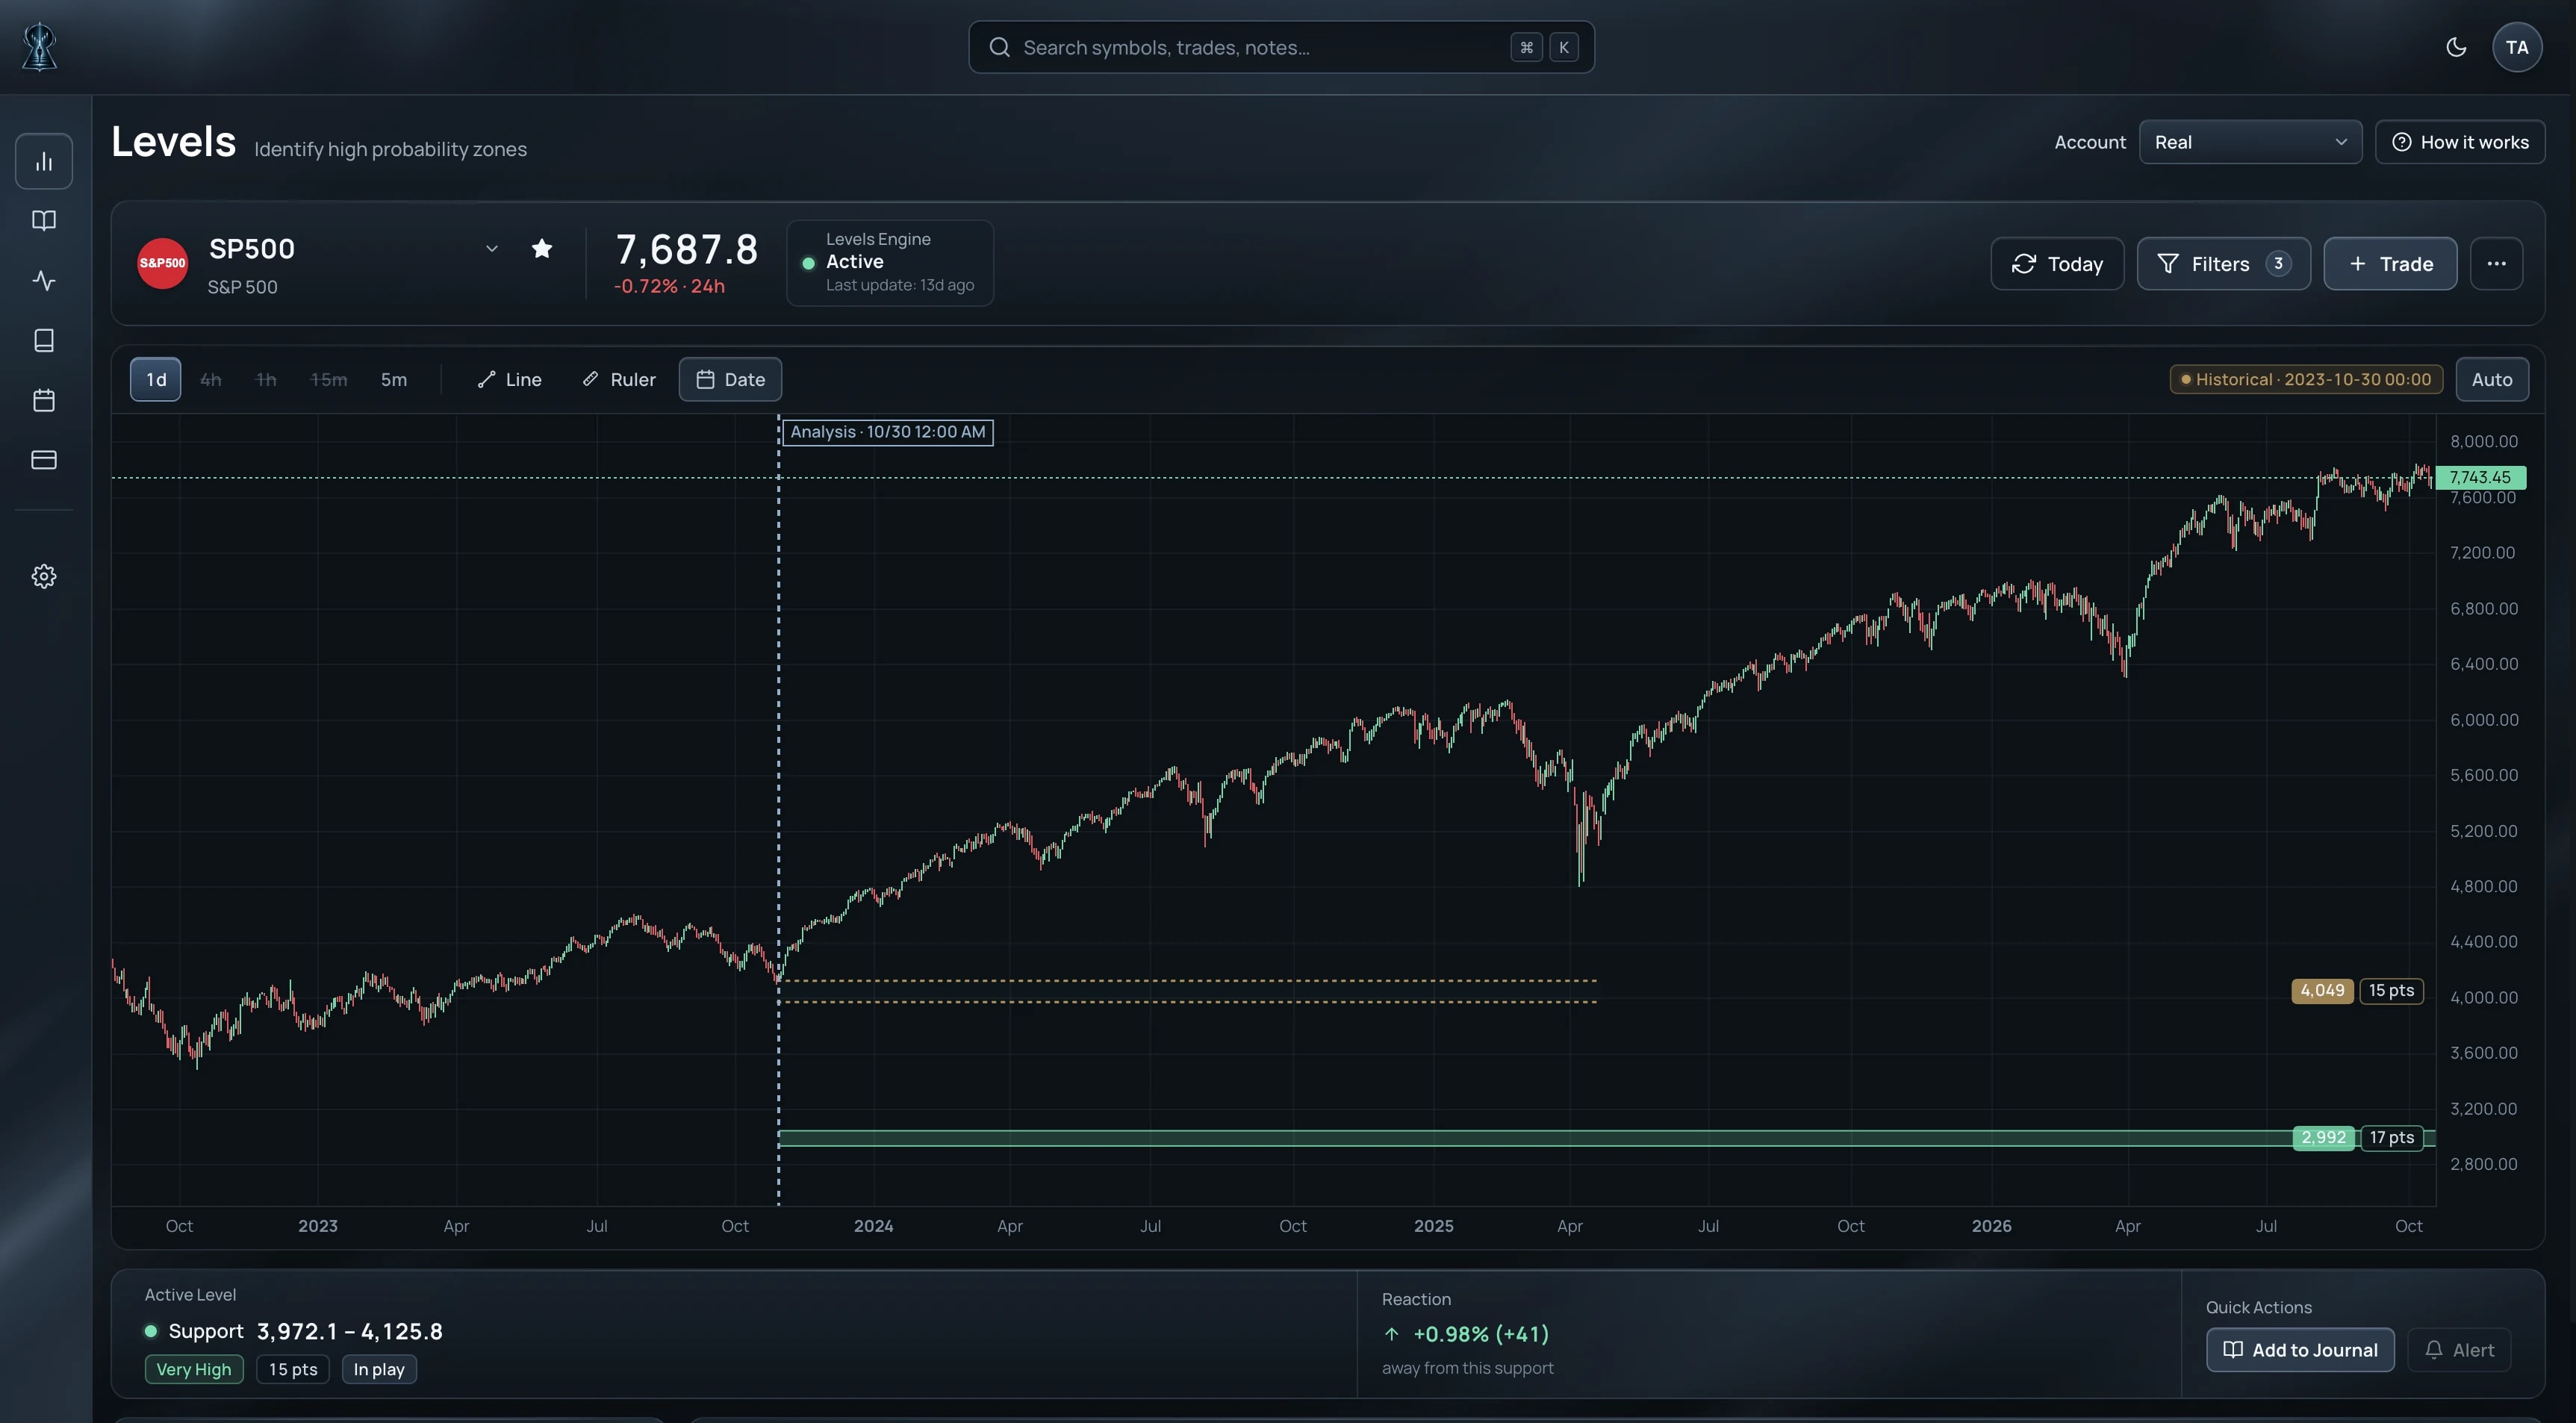
Sometimes price reacts immediately from the edge. Other times it sweeps through most or all of the zone, takes the liquidity inside it and then re-enters before the reversal develops.
Stop Loss placement can be adjusted based on the type of entry and the desired risk-reward ratio. Rather than covering the entire zone, it can be placed below the low or above the high formed during the price reaction. This allows for a higher RR, although it may result in a slightly lower win rate.
The Level is the edge.
If you already use RSI, moving averages, MACD or other confirmations, you can layer them on top instead of replacing the process that already works for you.
Read the whole map
A single Level can show you an opportunity. Clusters of Levels can reveal where liquidity is concentrated and where the market may have more room to travel.
When there is a clear imbalance between the Levels above and below price, the market may be more likely to move toward the side where more liquidity is waiting.
When liquidity is distributed more evenly on both sides, the map can instead point to a range, with the outer Levels becoming more relevant areas to watch.
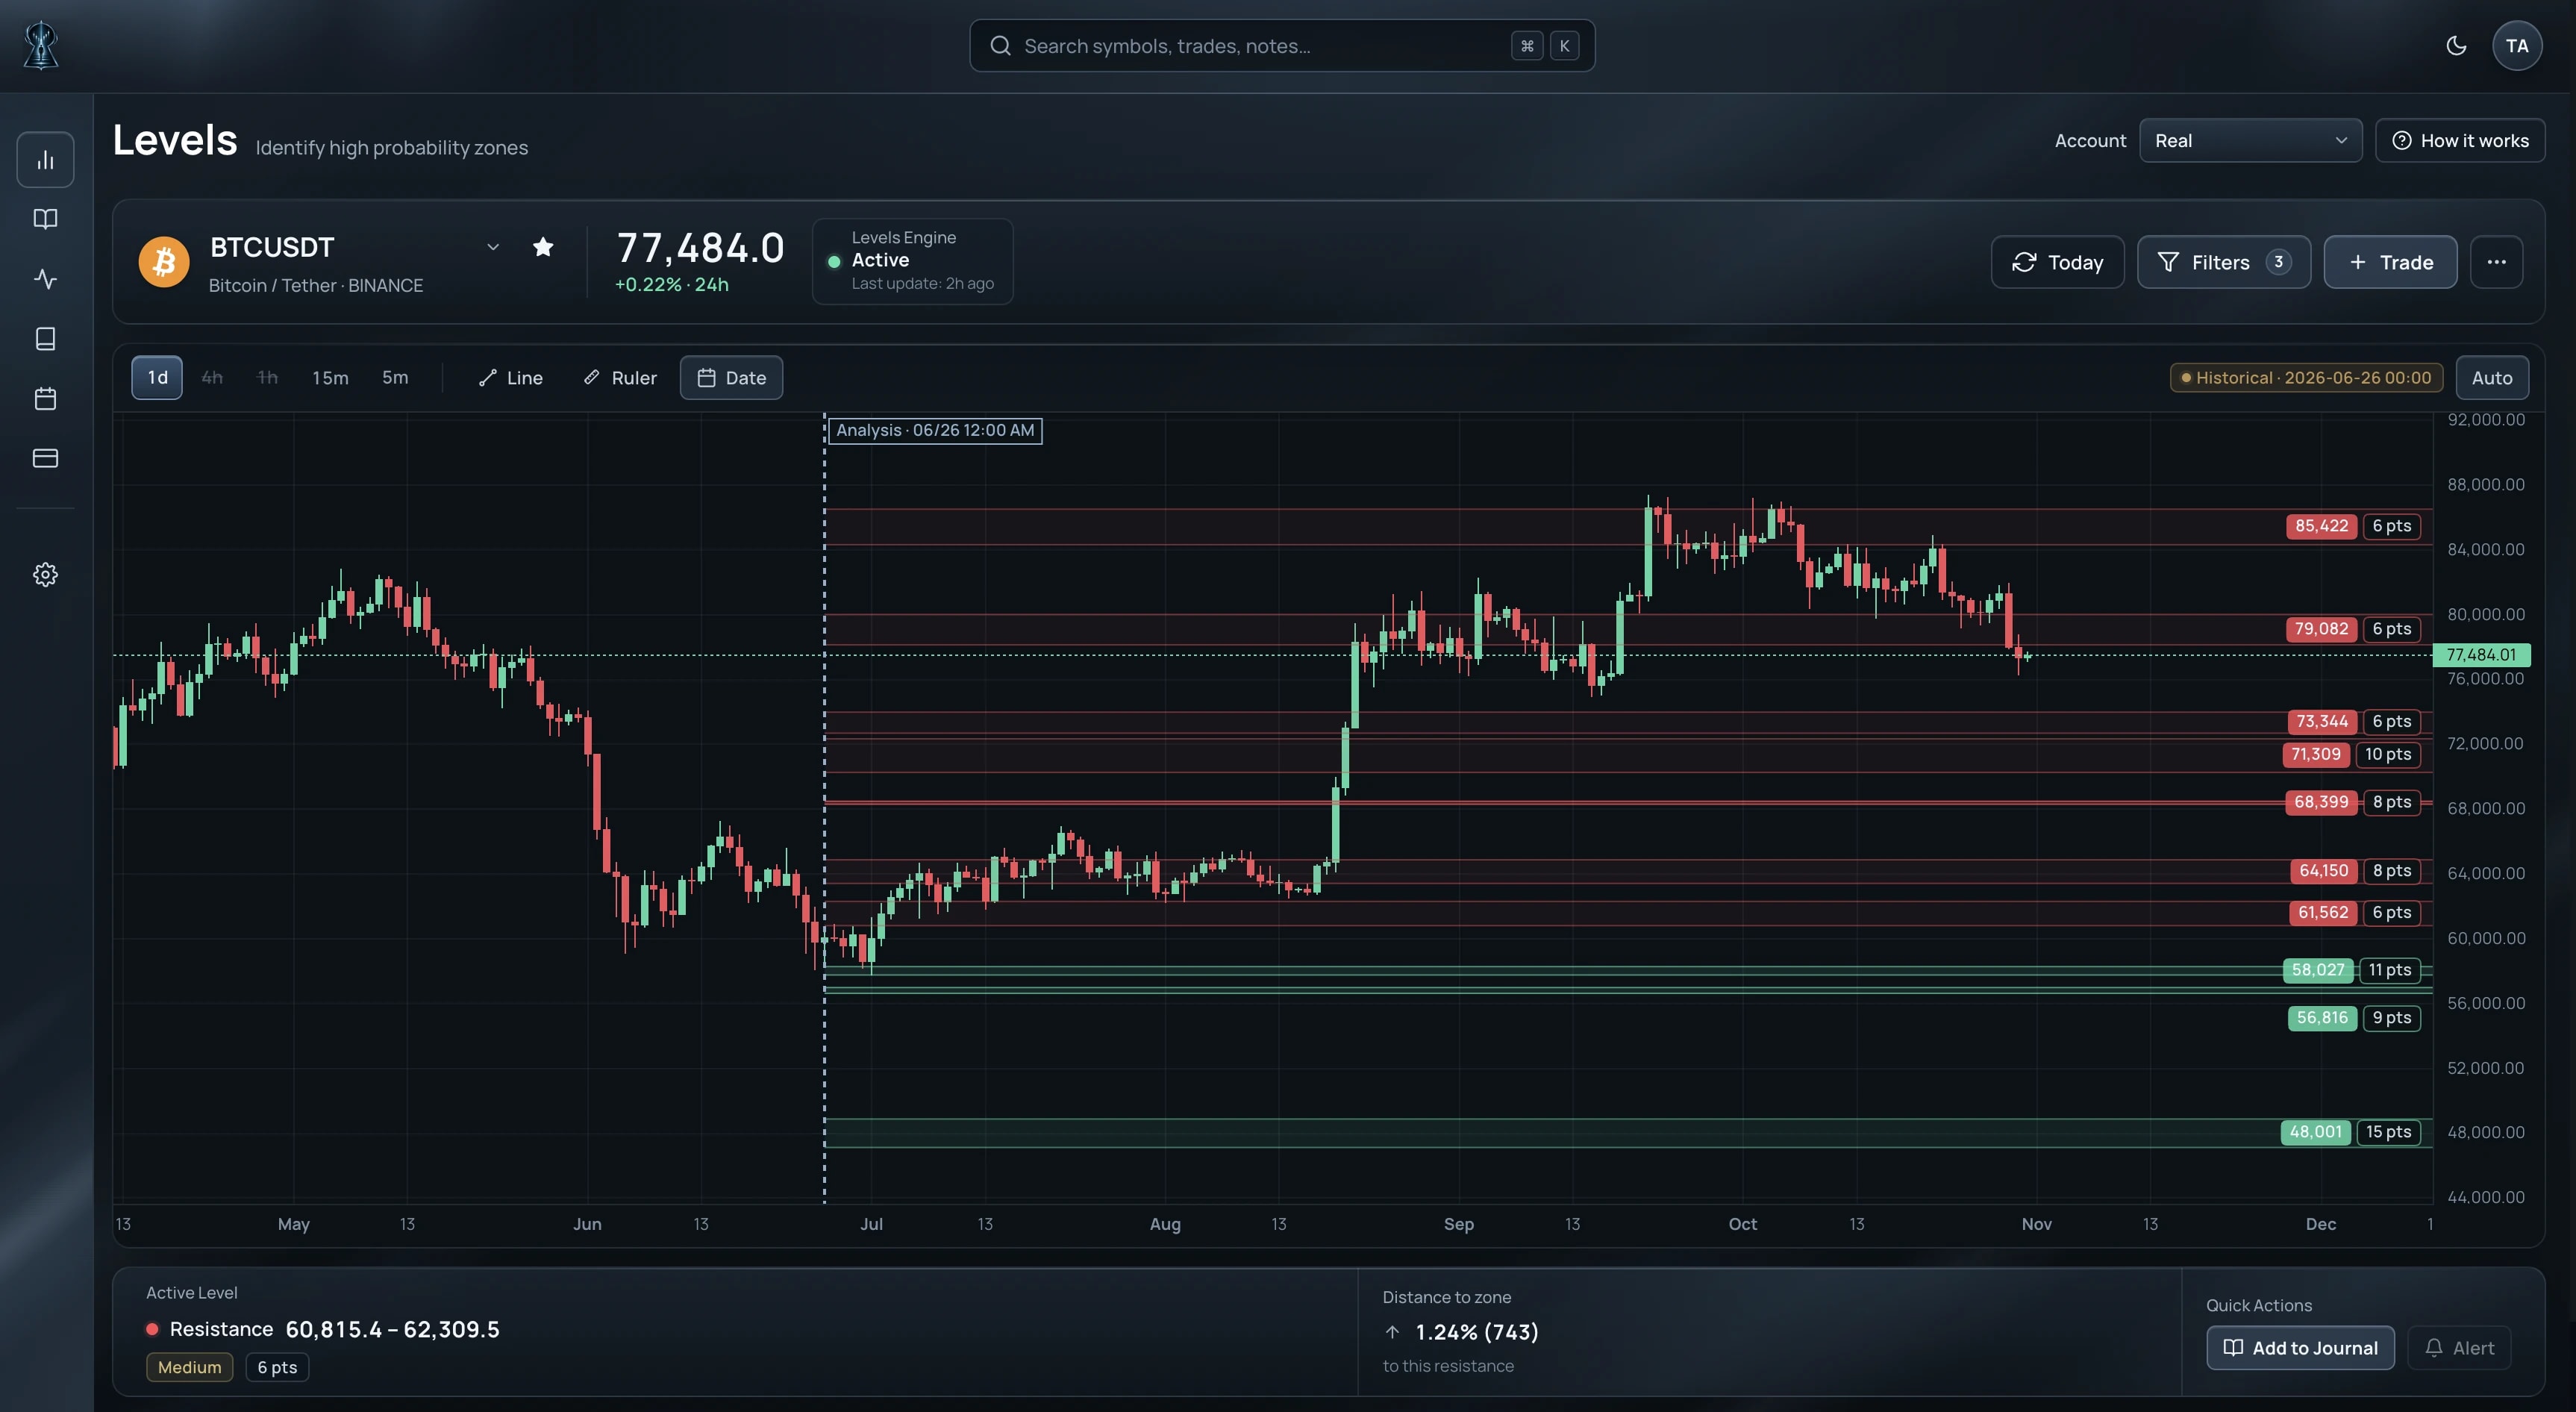
Large liquidity cluster above
Limited liquidity below
Secret Levels turns liquidity concentrations into tradeable opportunities.
Levels can matter long before price gets there
A Level doesn't need to be close to price to matter.
Secret Levels can surface important zones far from the current market across different timeframes.
On higher timeframes, those Levels can become long-term reference points for potential floors, ceilings or major targets well before the market approaches them.
Once you're already in a trade, opposing Levels further away can also help you identify reasonable take-profit areas from the moment the position is opened.
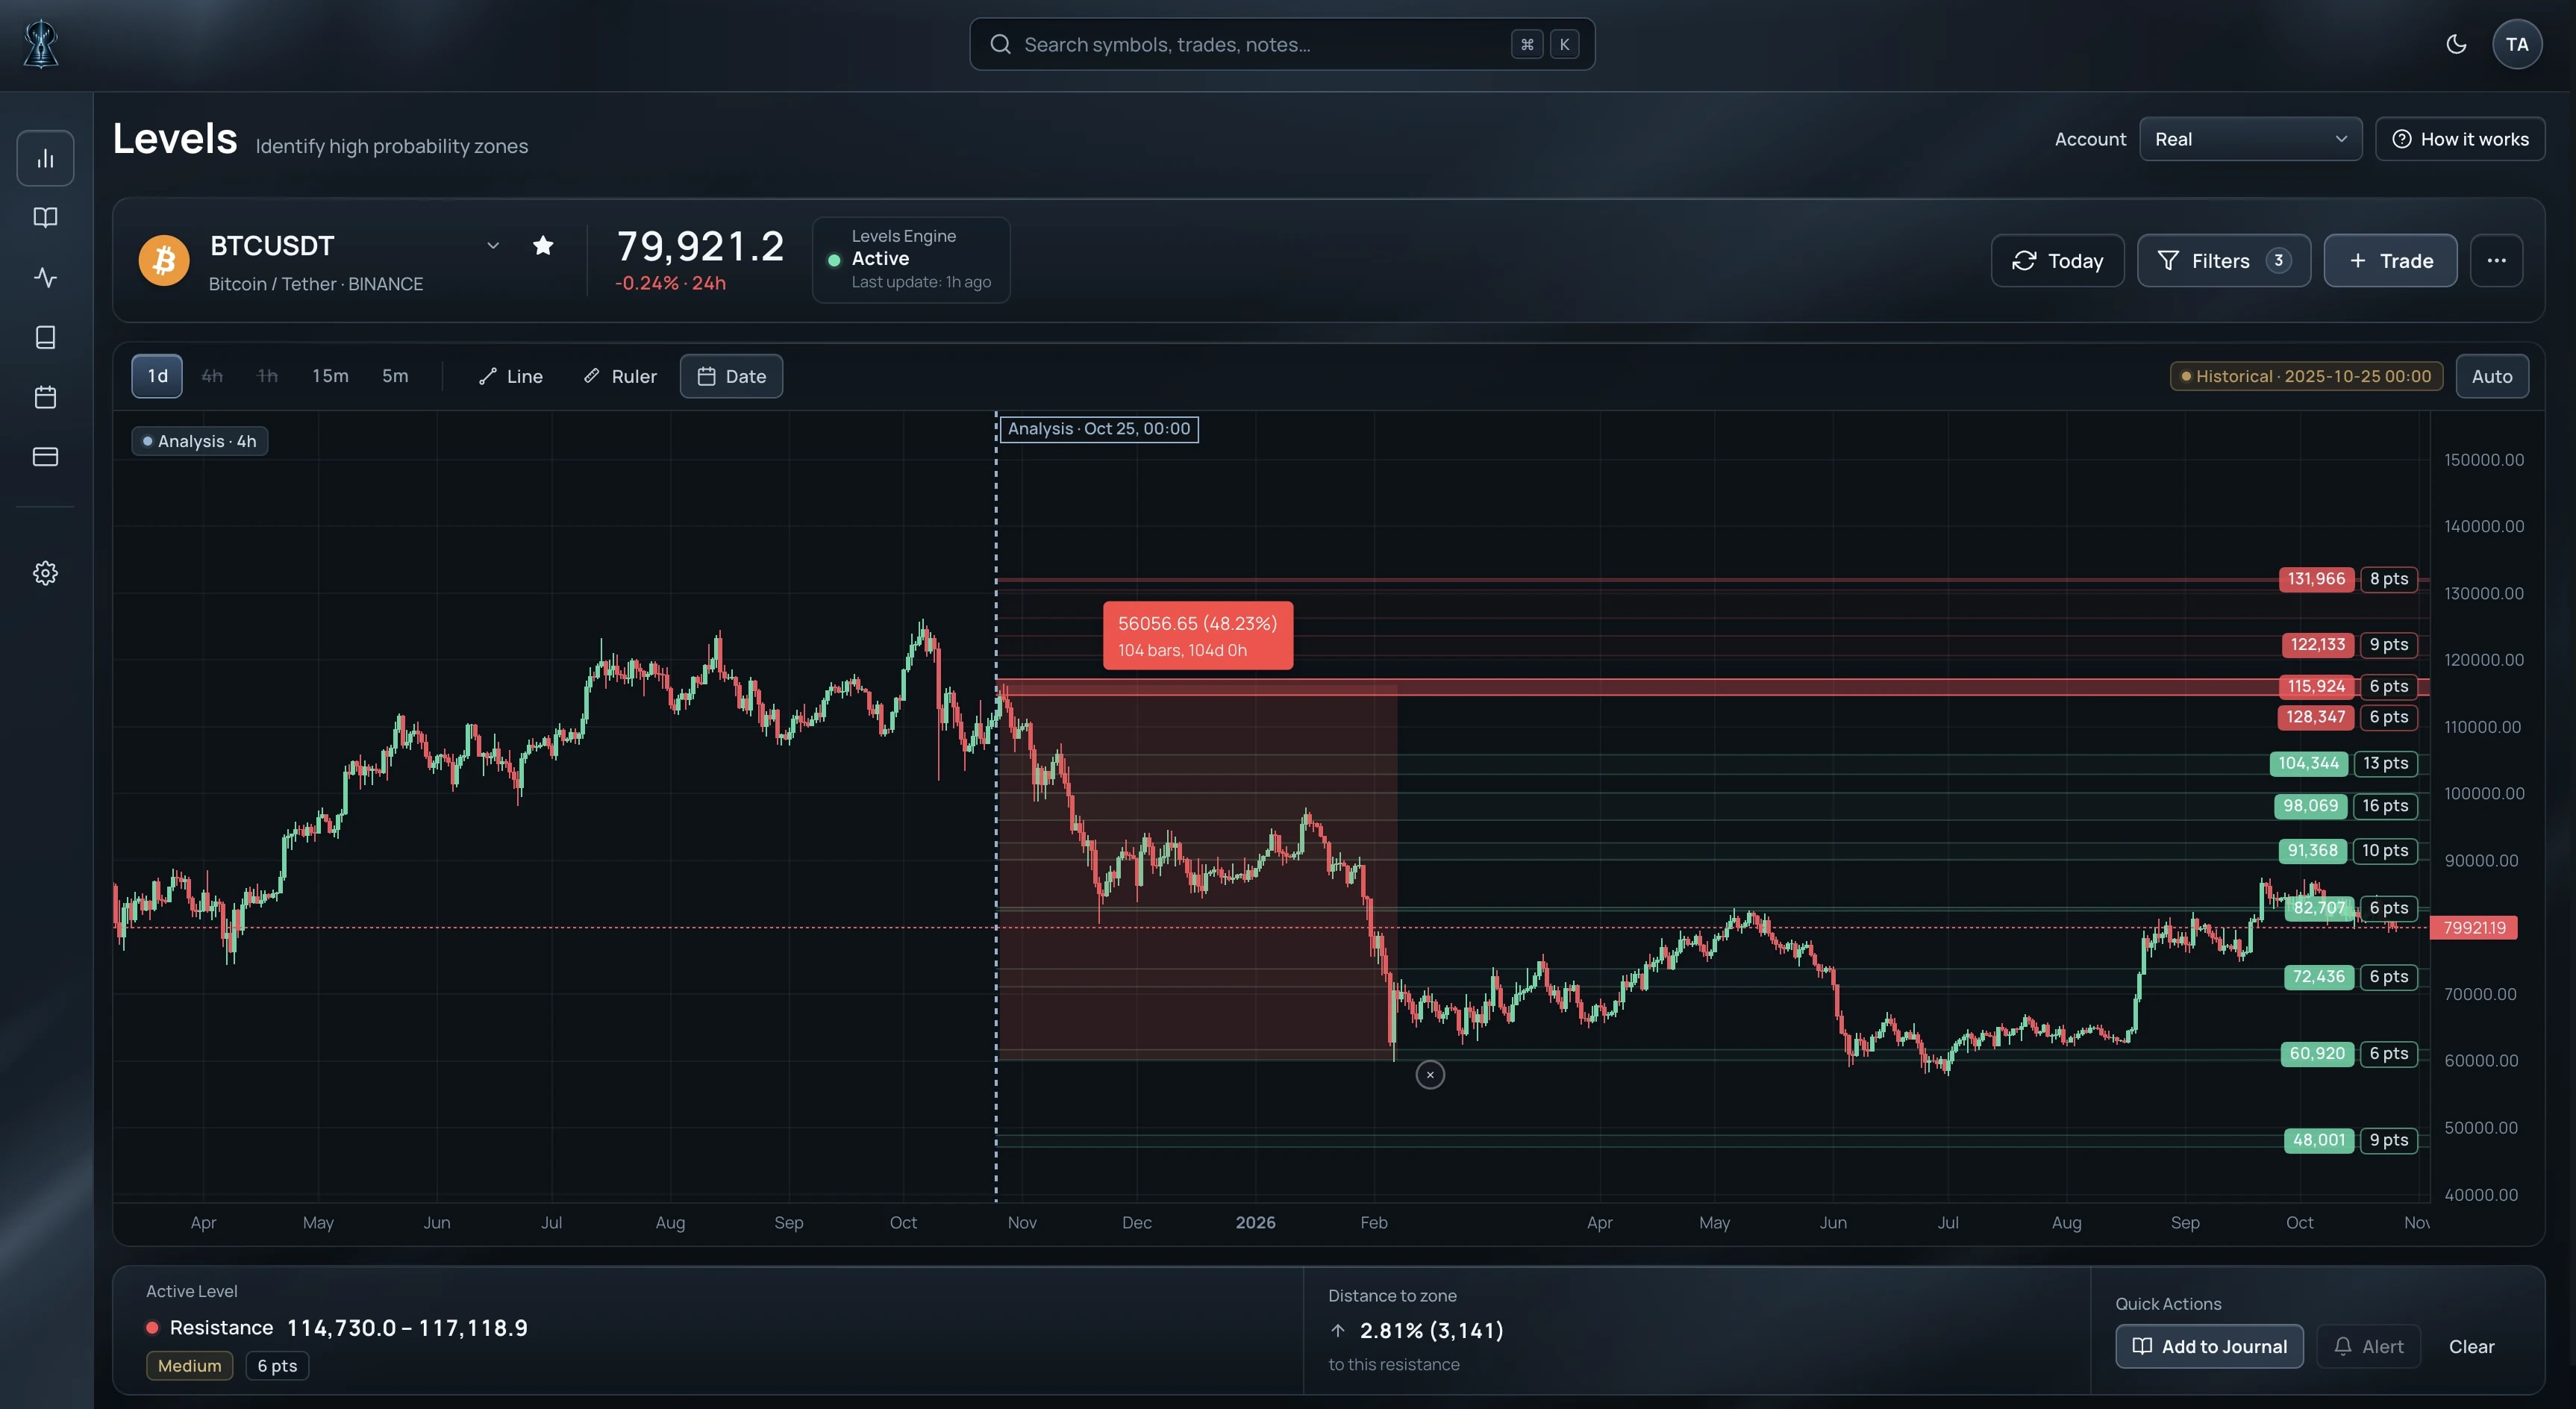
Across markets. Across timeframes.
Use Secret Levels across indices, stocks, commodities, forex and crypto, on different timeframes depending on how you trade.
Trade a timeframe on its own or combine higher-timeframe Levels with lower-timeframe entries.
Years underneath. One Level on the chart.
Behind every Secret Level are years of trading and research into market behavior and market structure.
What reaches the chart is intentionally simple: a precise price zone and a strength score, visible before price gets there.
You see the structure. Not the mathematical research, quantitative infrastructure, and technology beneath it.