

Go back. Check the Levels yourself.
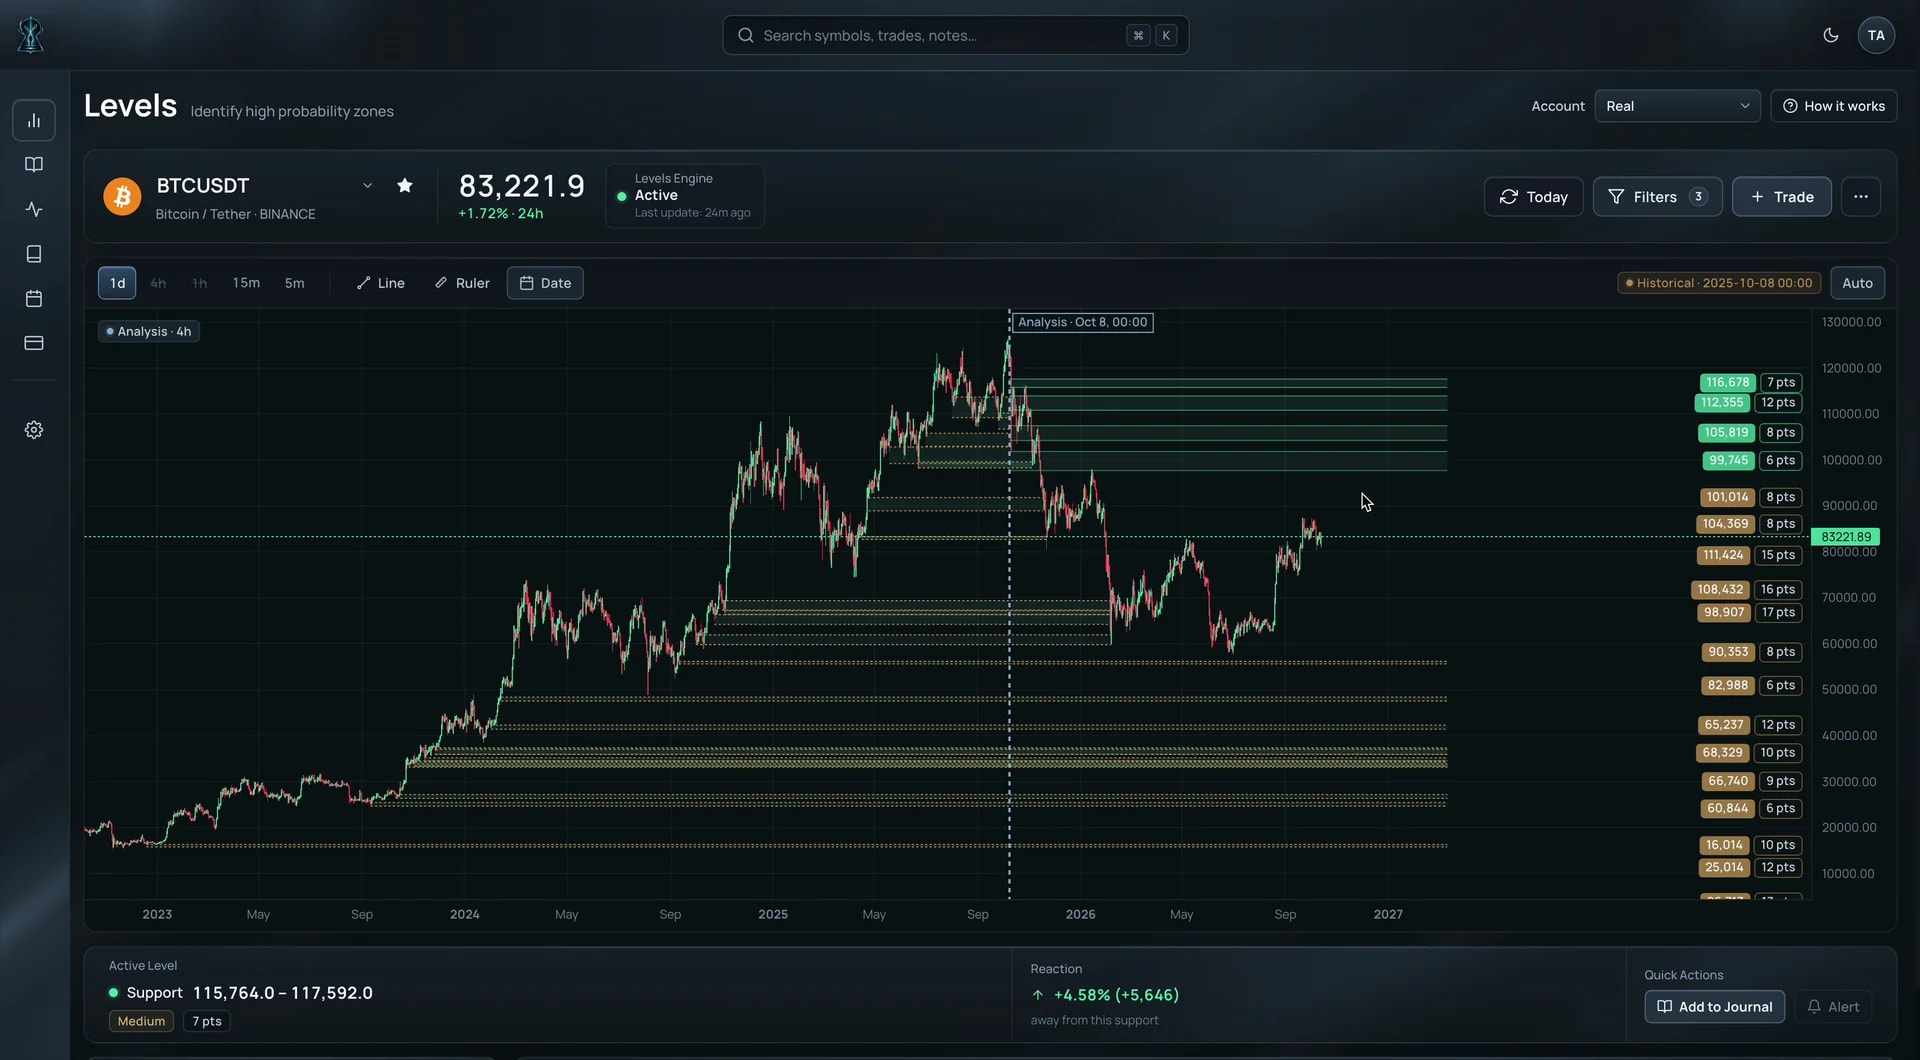
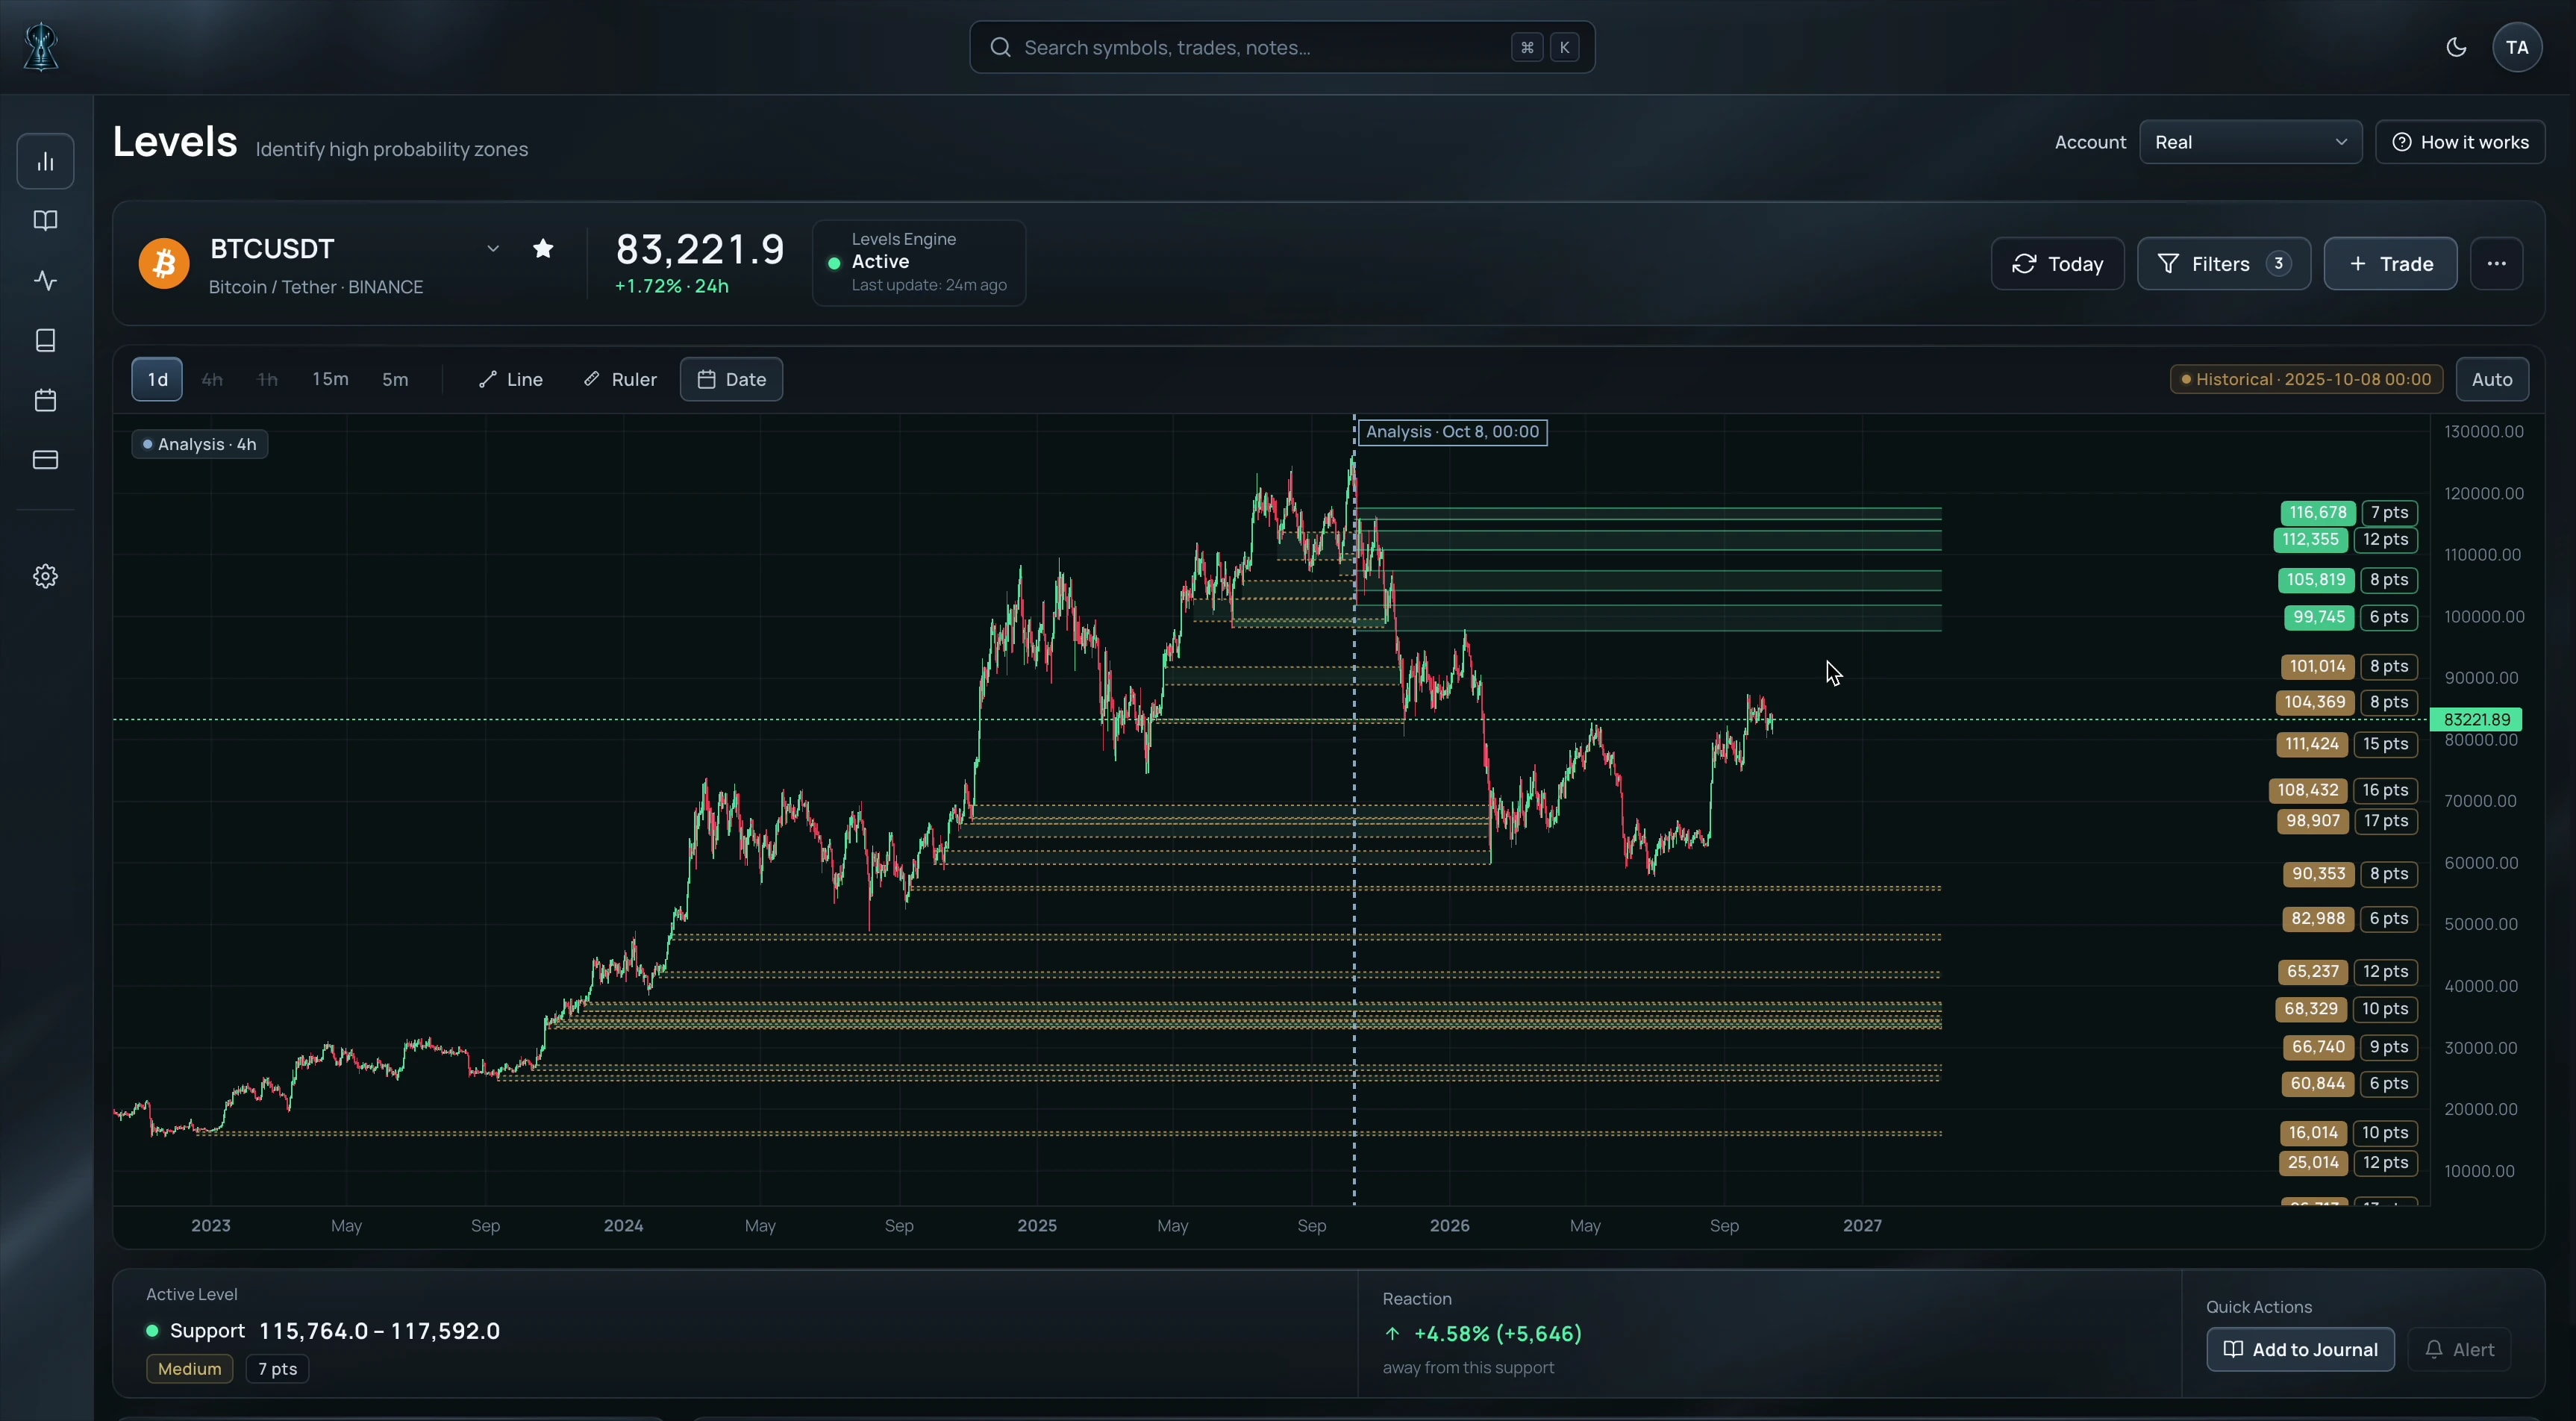
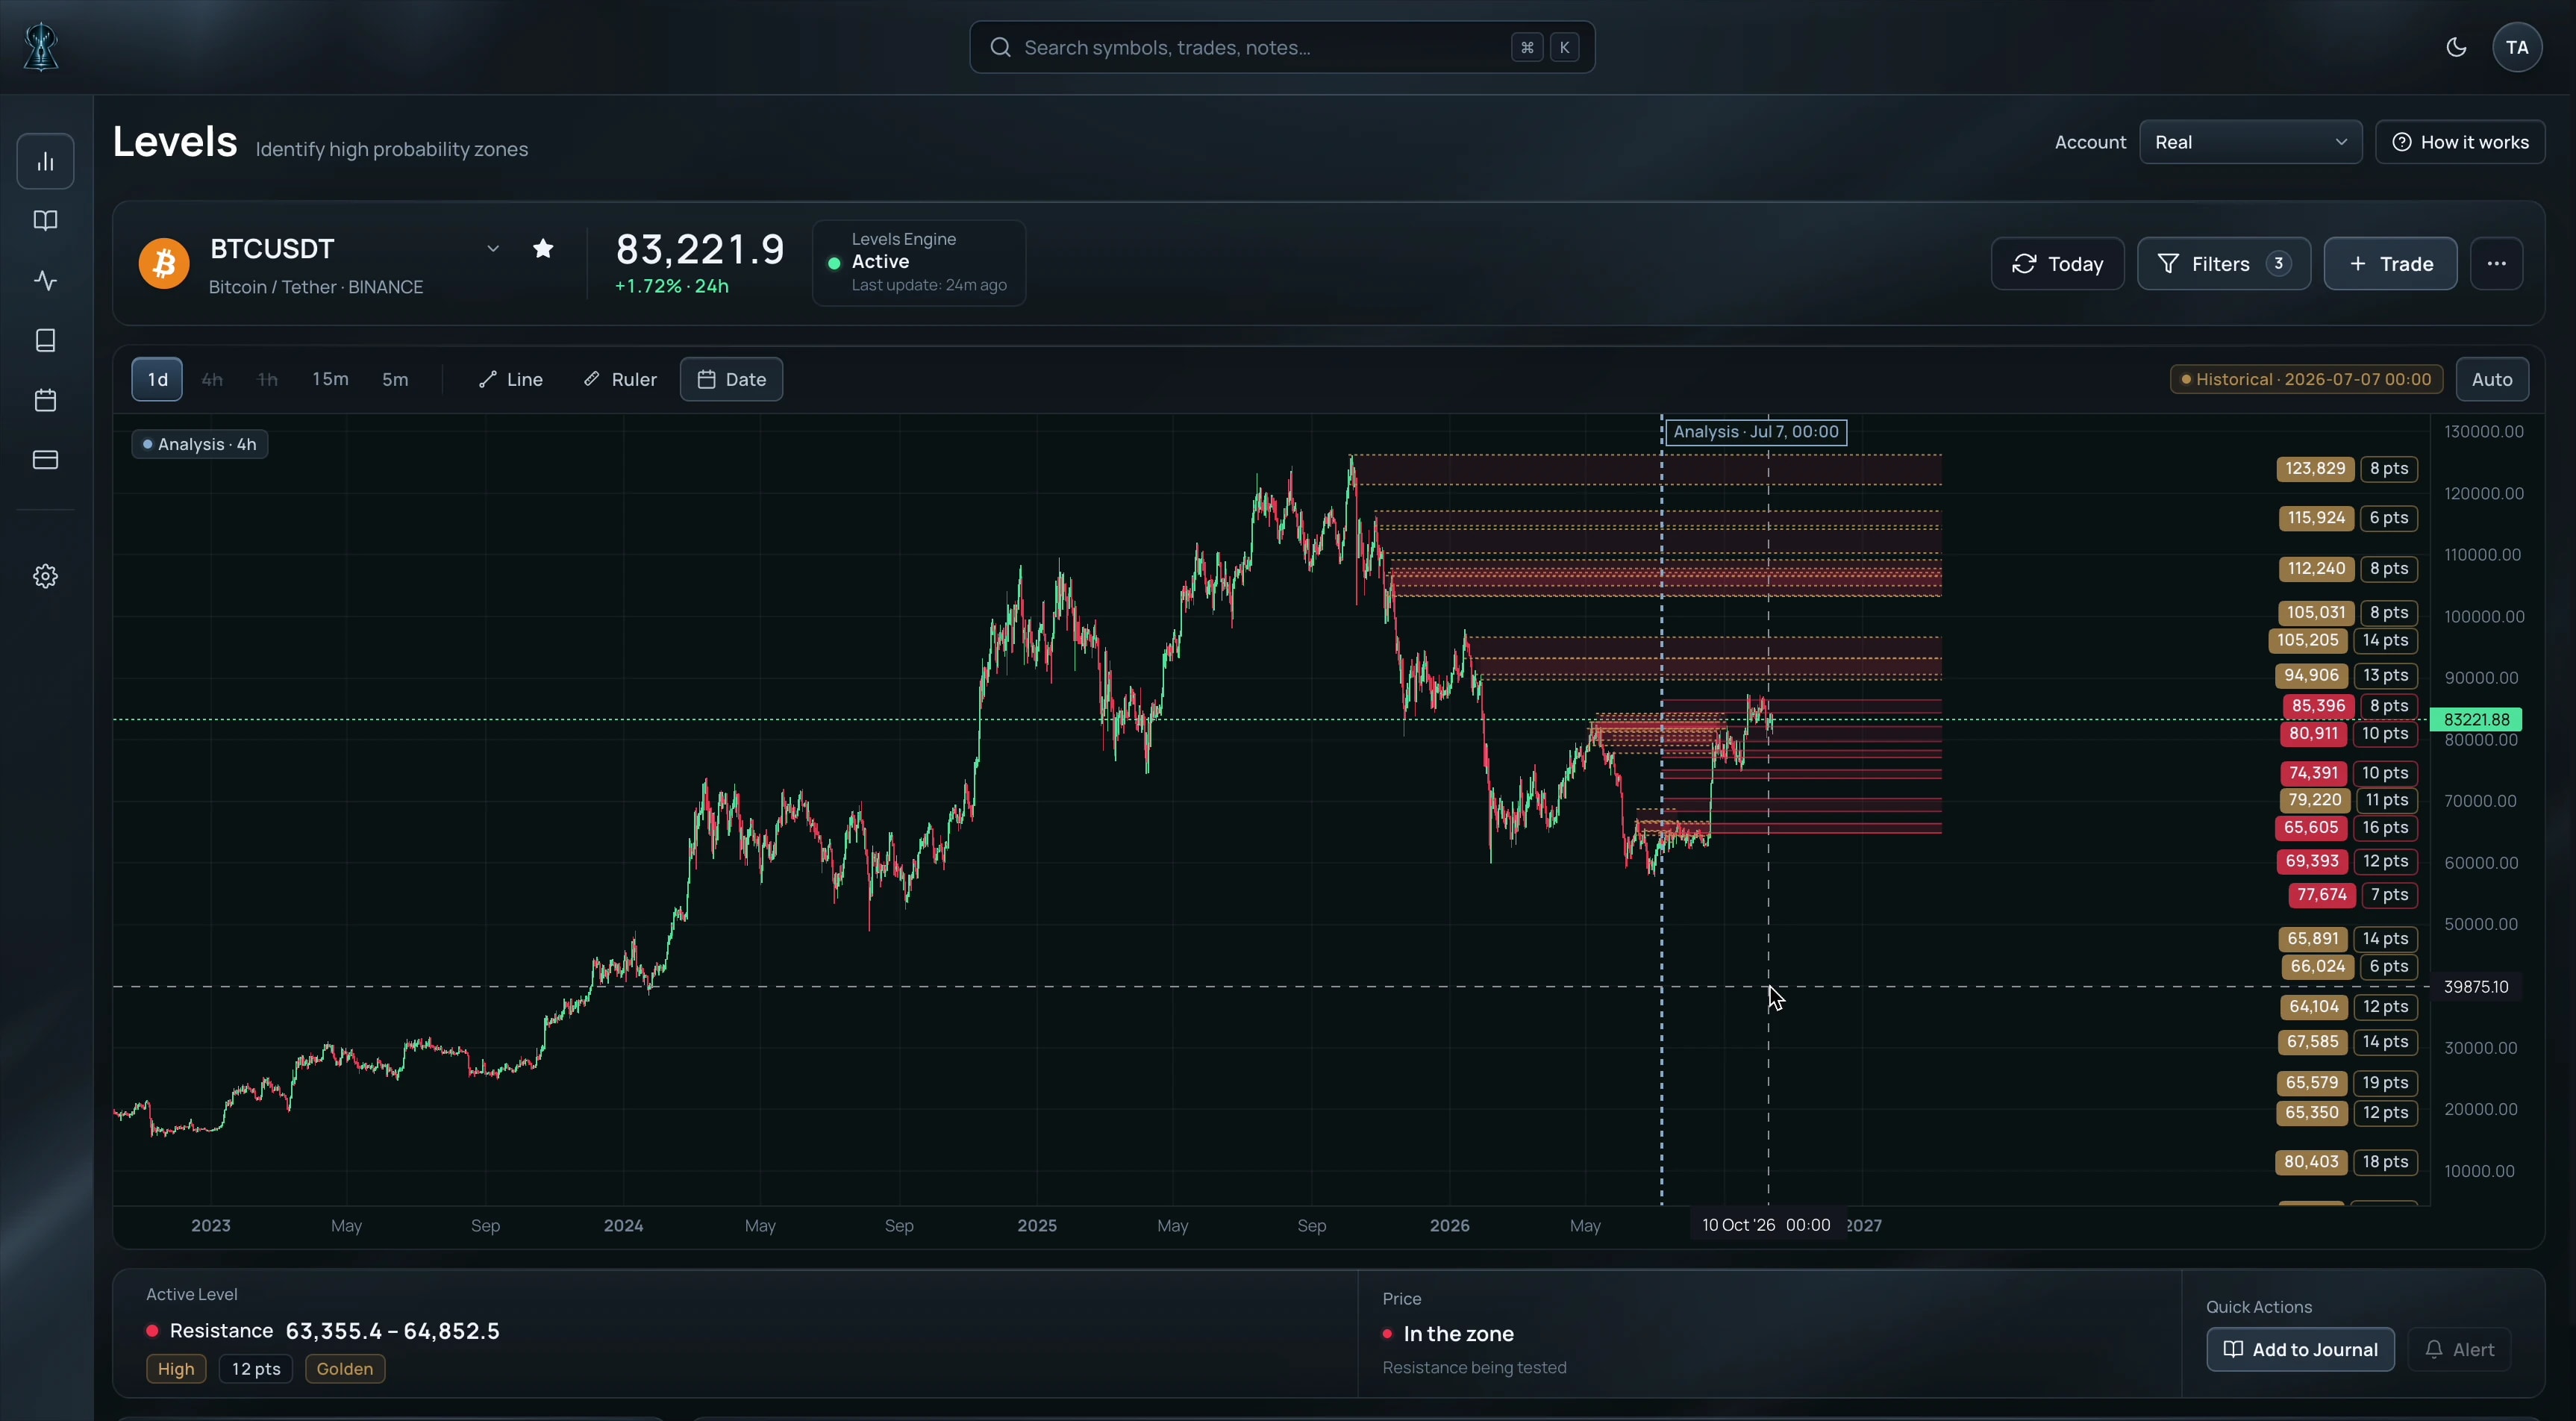
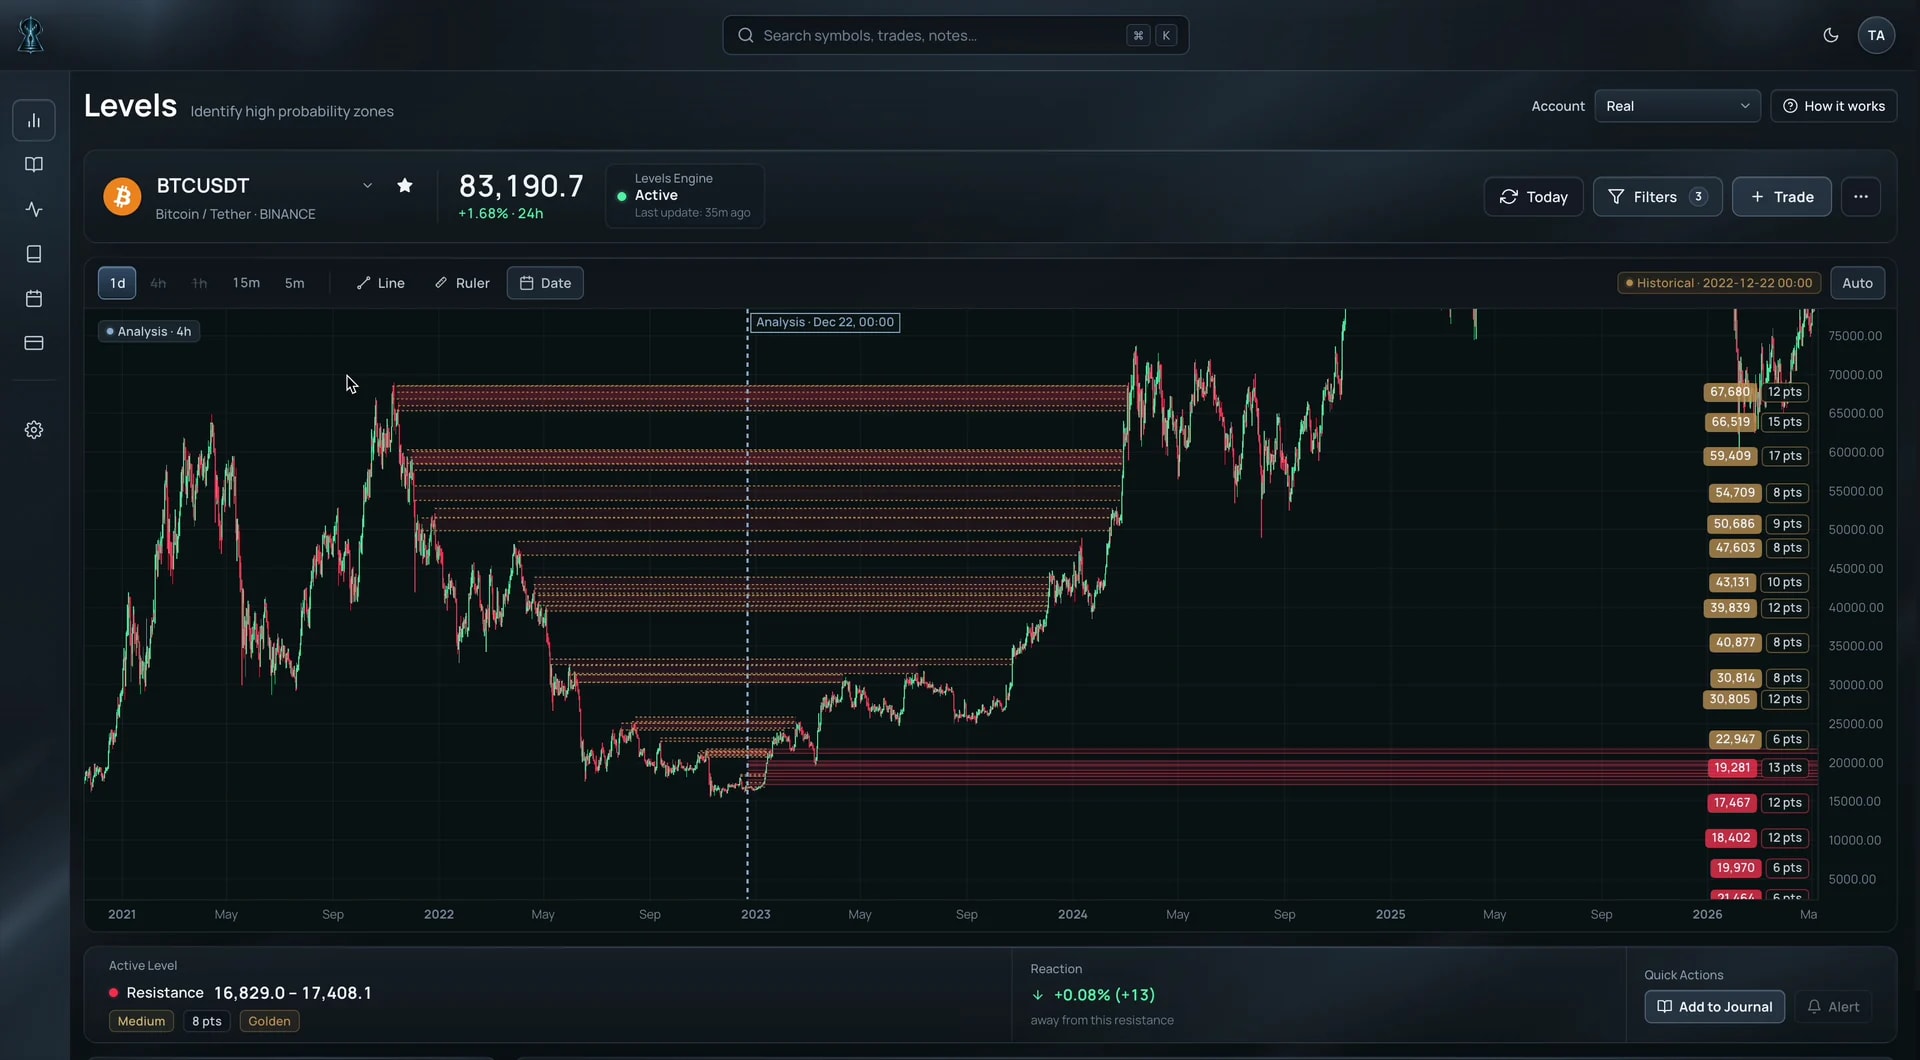
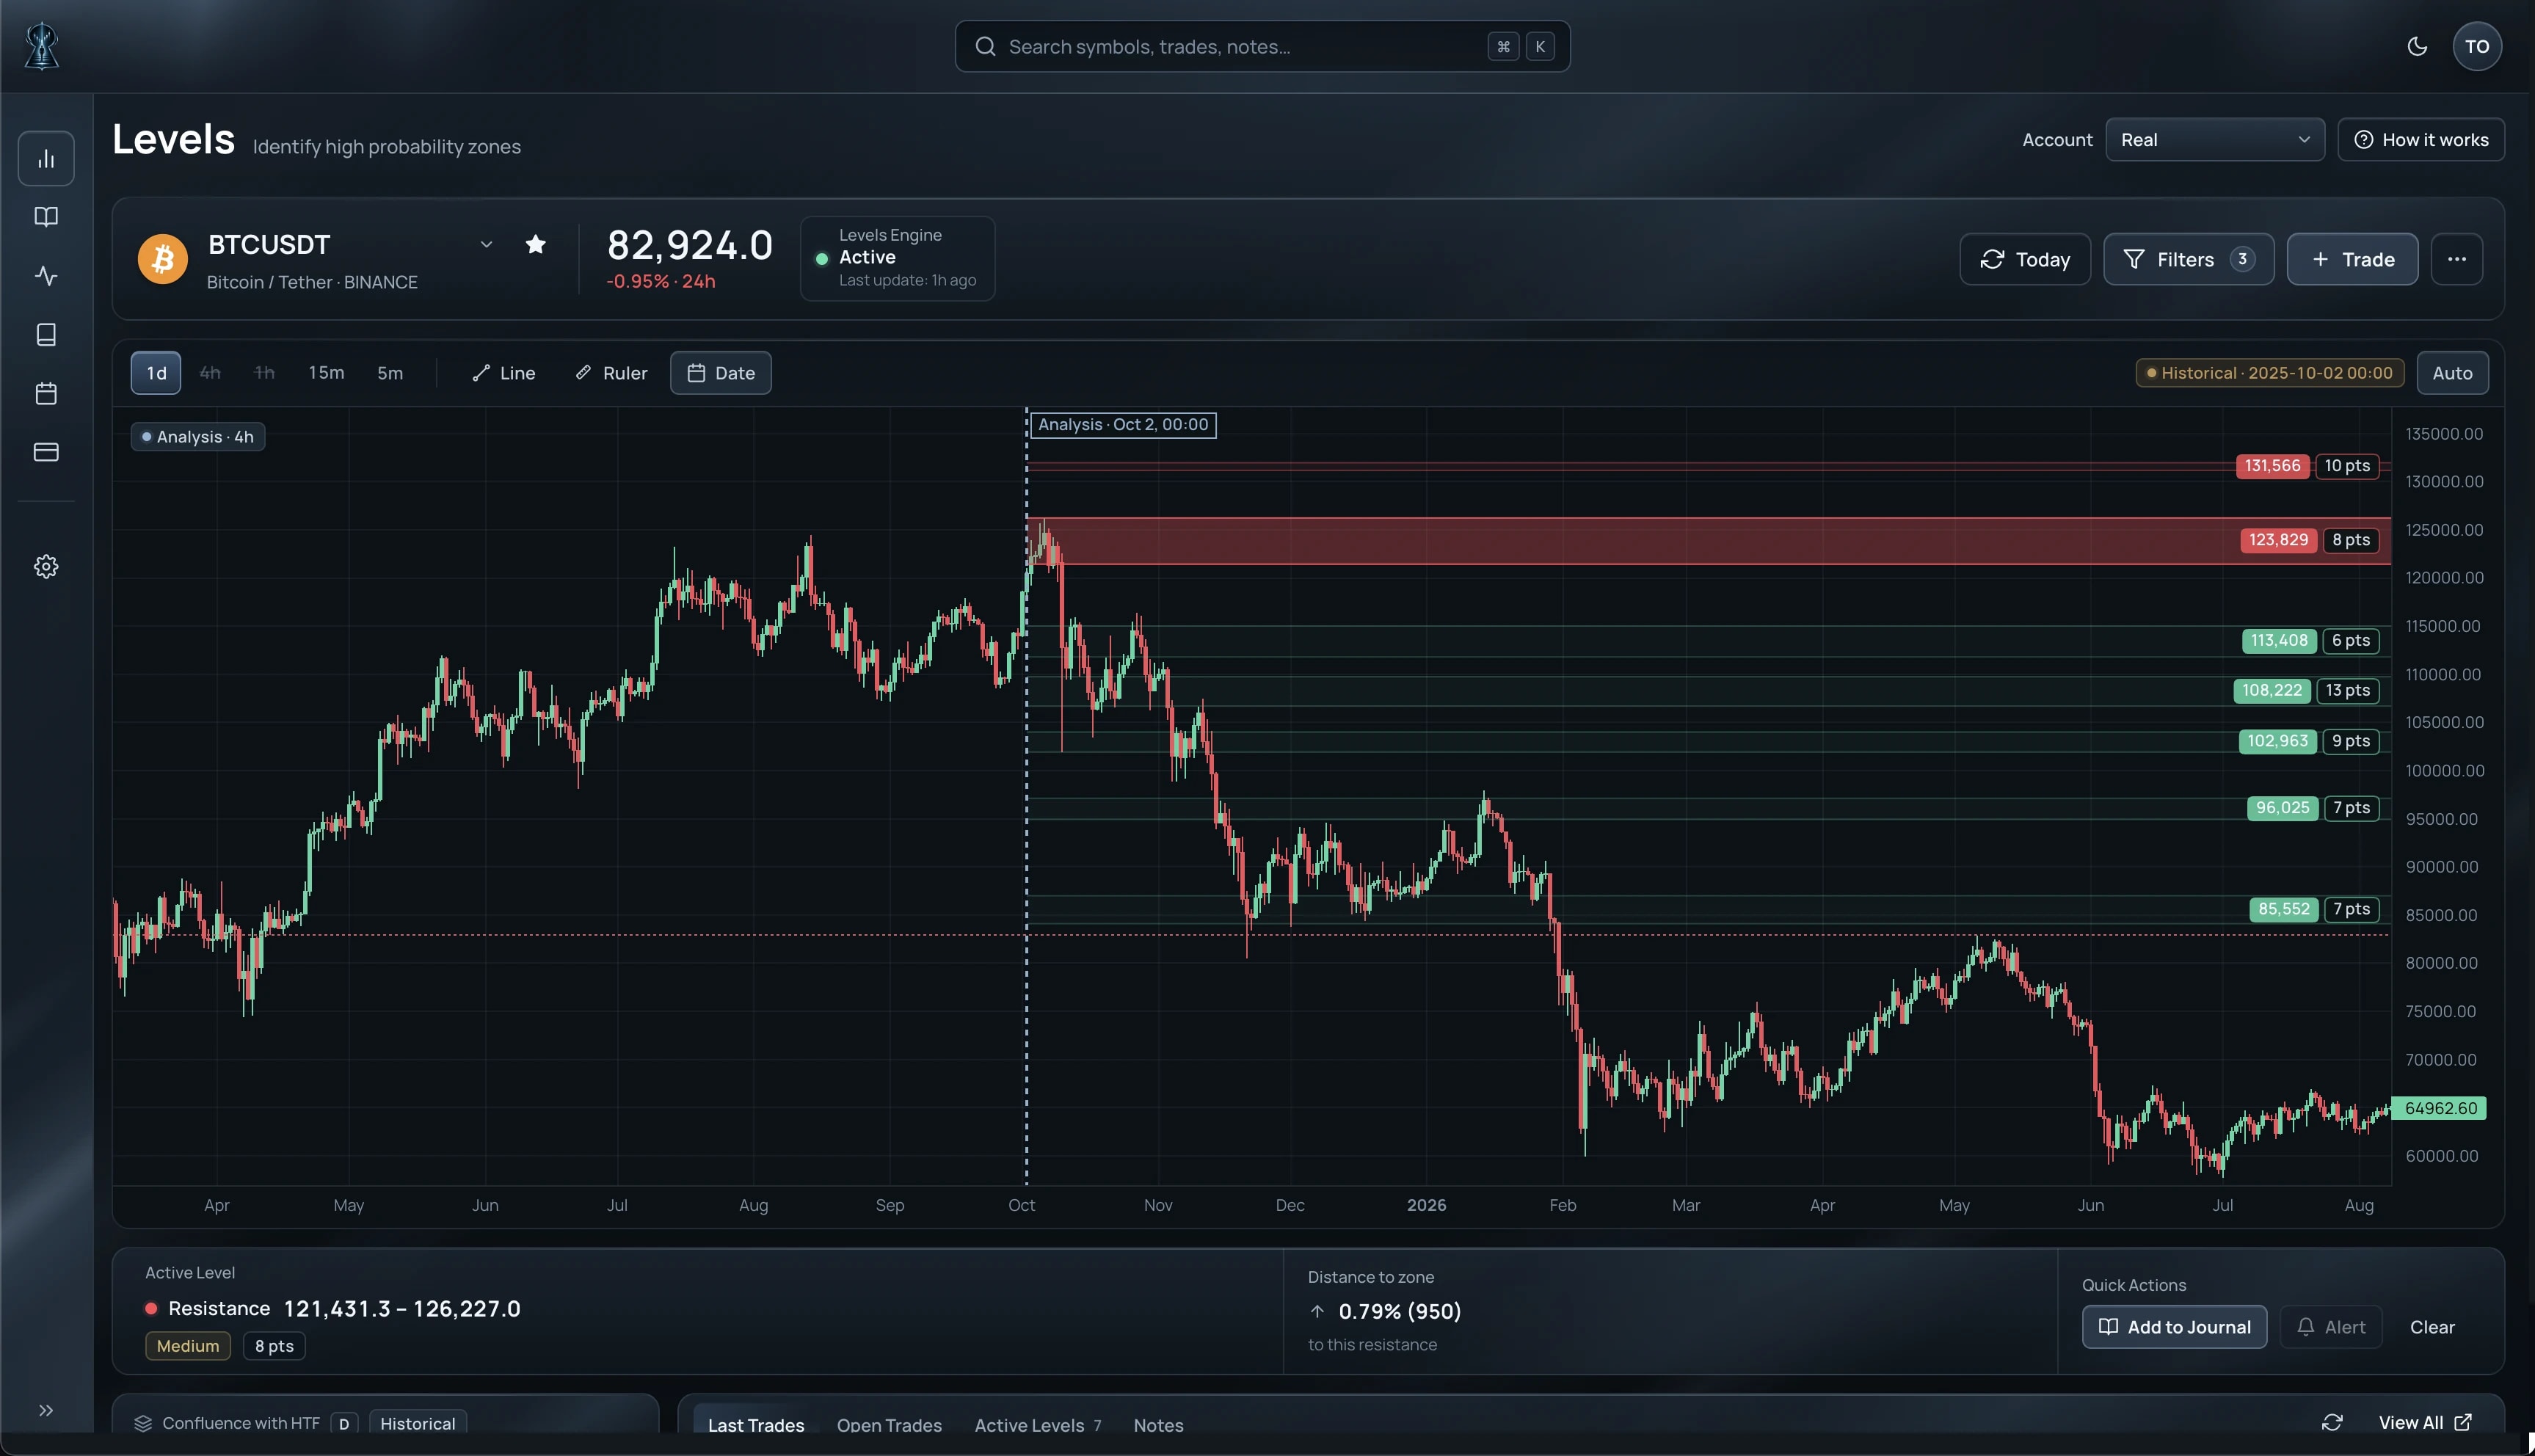
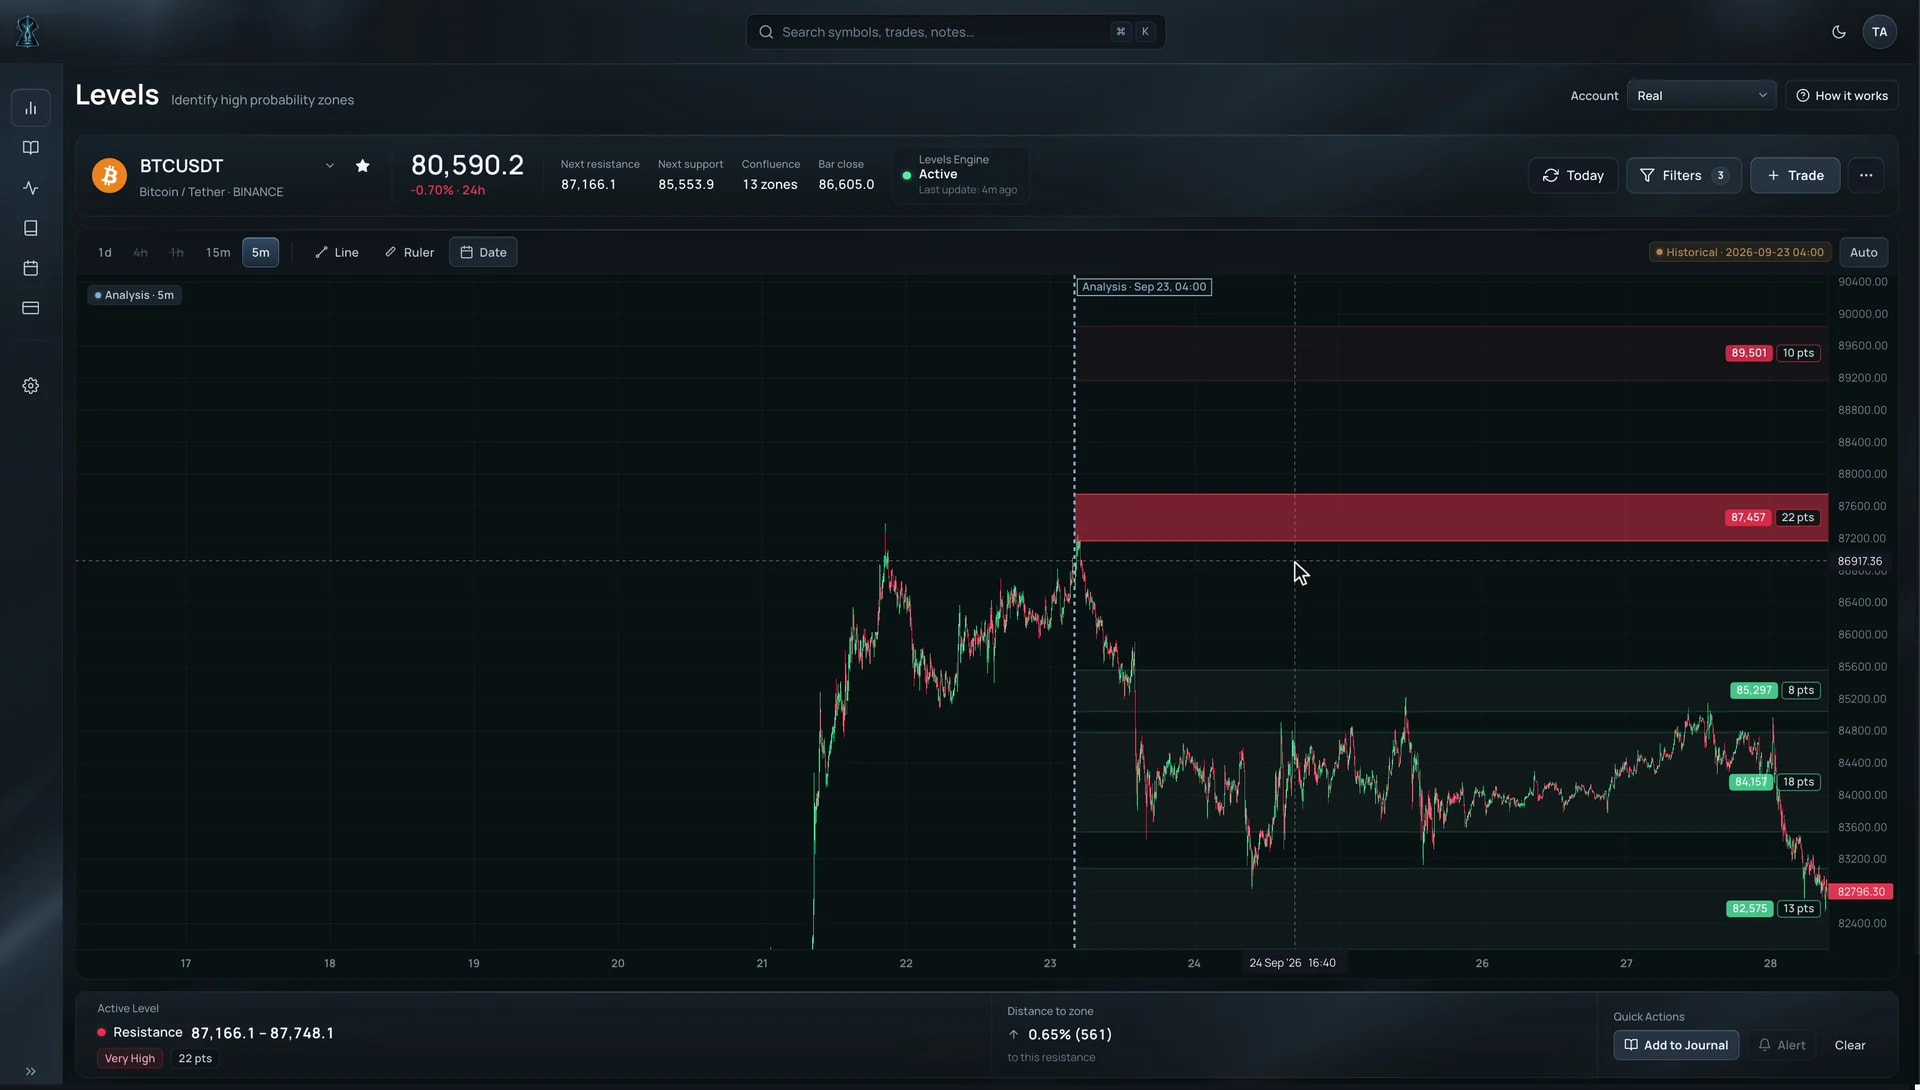
Pick any candle in the past and Secret Levels reconstructs the Levels using only the information available up to that moment.
No future data. No Levels plotted in hindsight.
Verify it yourself
Don't take our word for it.
Pick the market. Pick the timeframe. Pick the date.
Move through the chart and see exactly which Levels Secret Levels displayed at that point in time, then see how price reacted around them.
S&P 500 · Daily
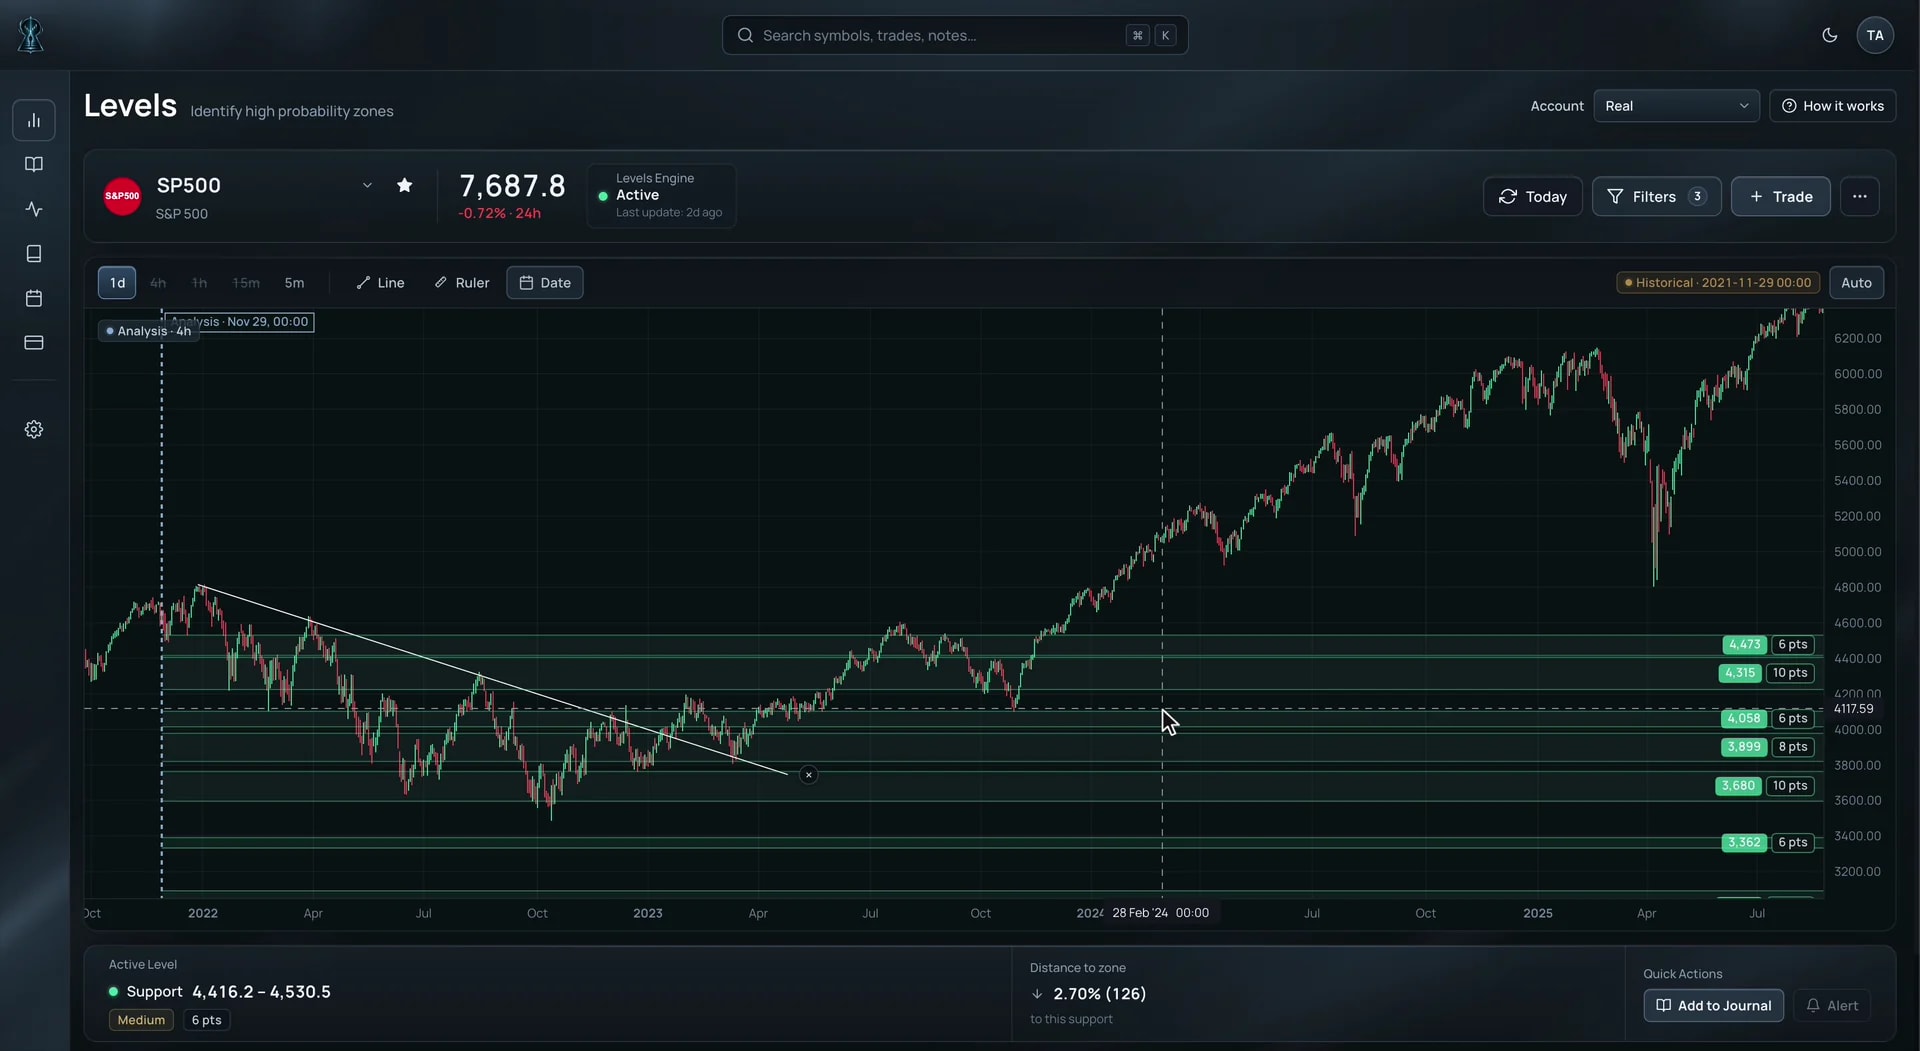
EUR/USD · Daily
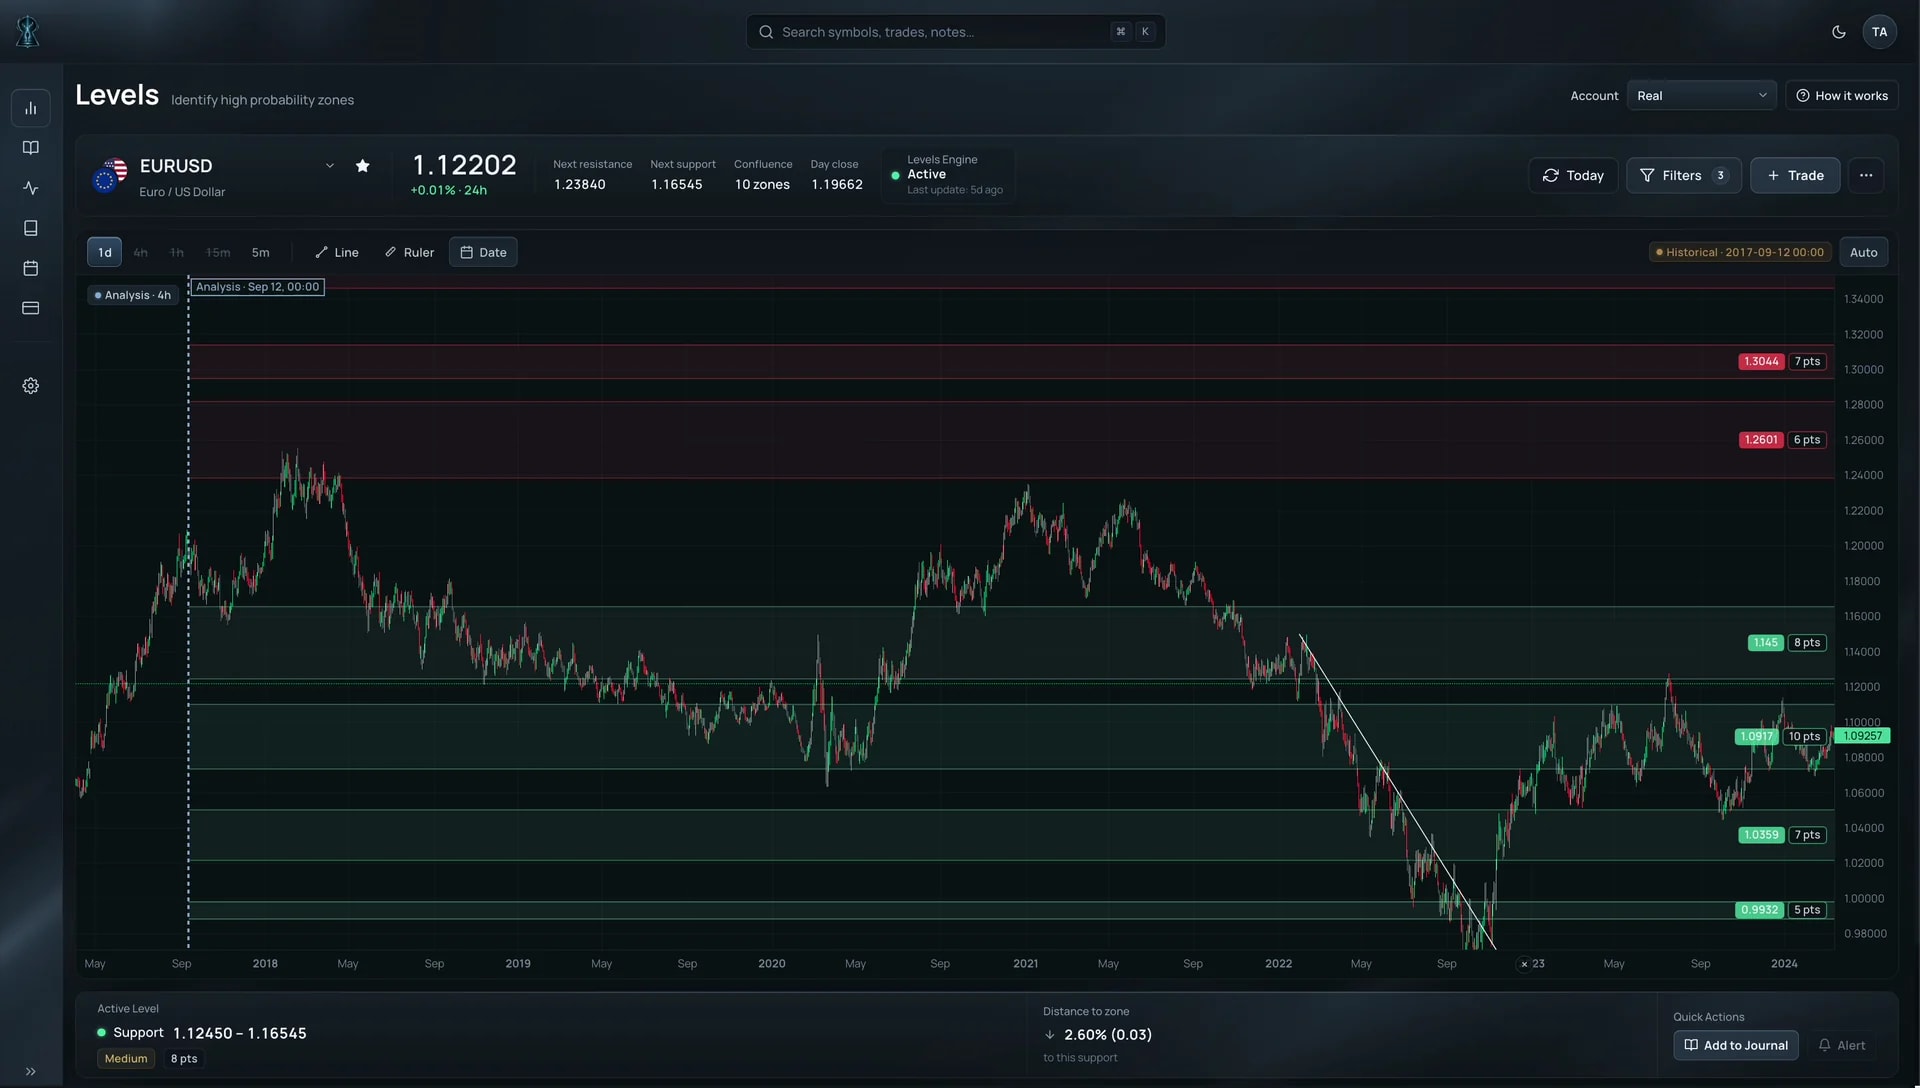
Gold (XAUUSD) · 5-minute
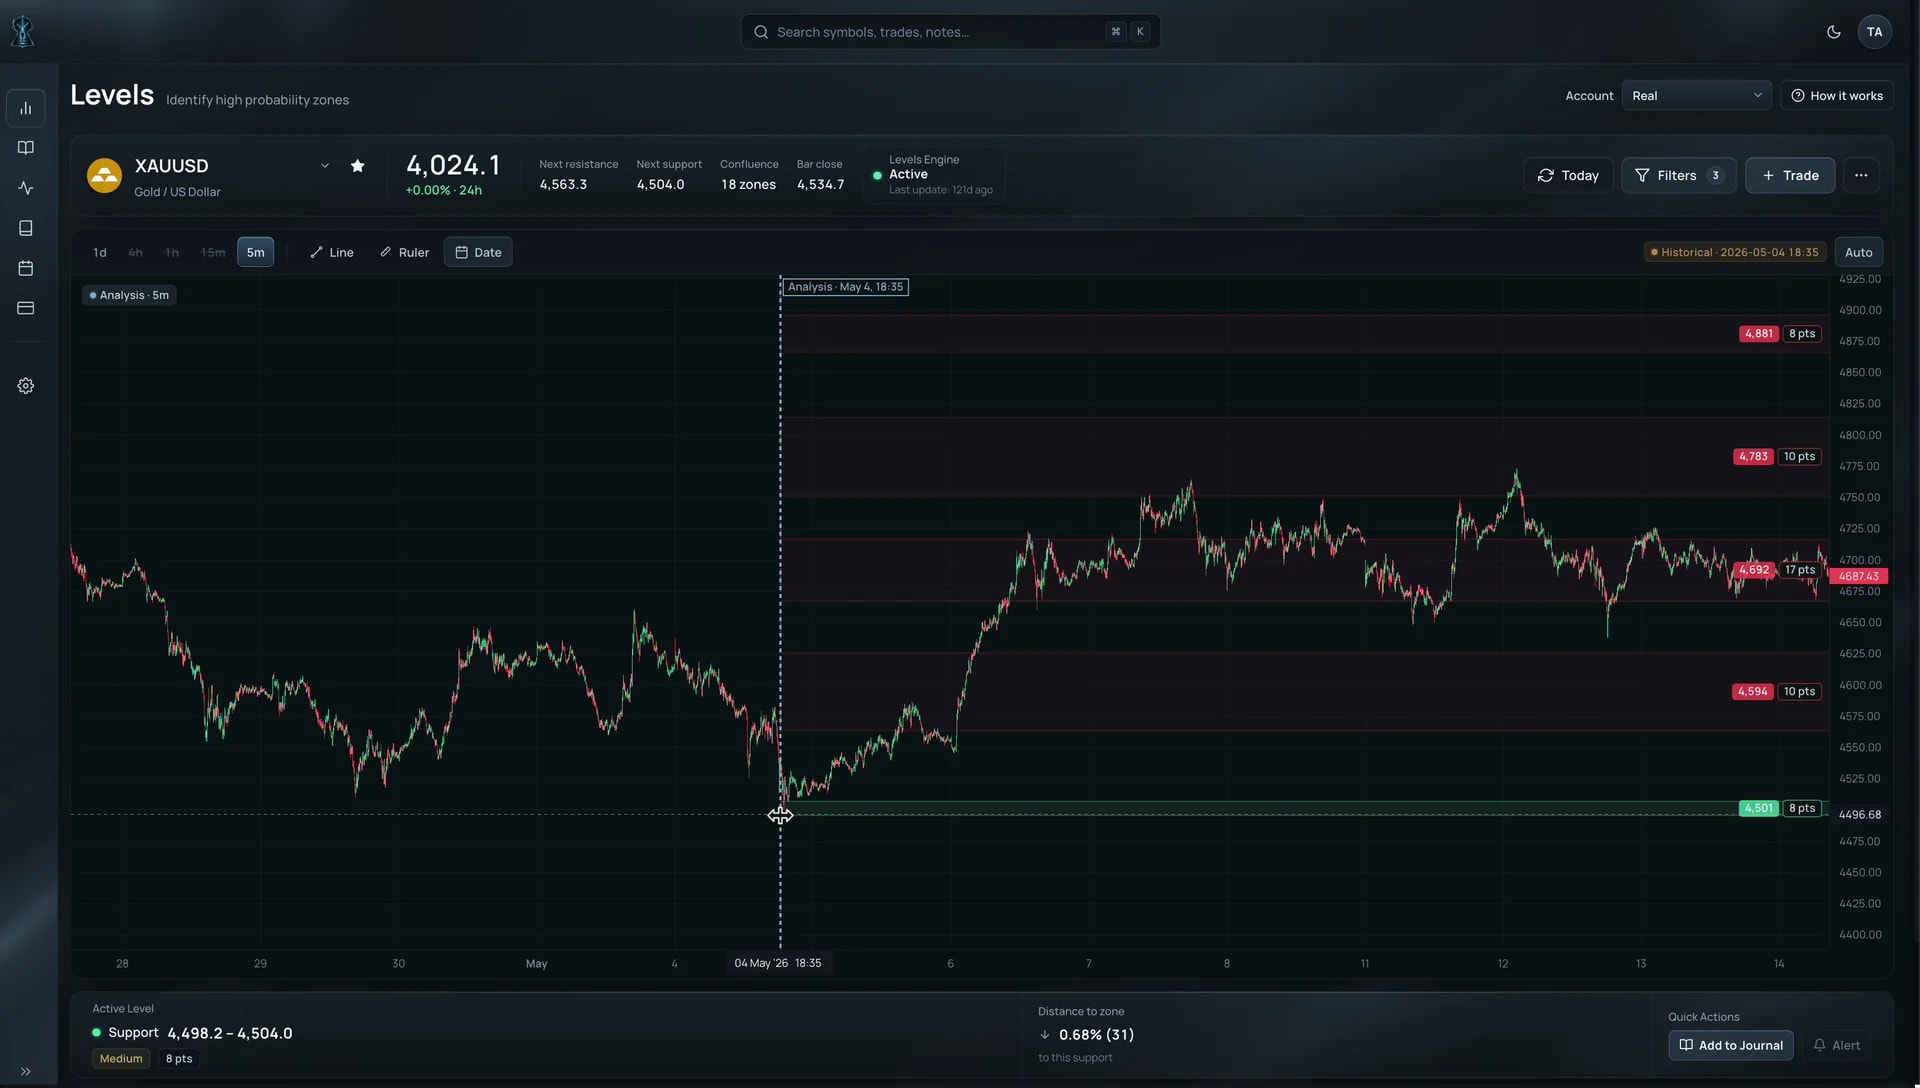
BTCUSDT · 5-minute
Golden Zones
Put your own trade rules to the test.
Configure your take-profit, break-even and stop-loss rules. Golden Zones highlight the trades that would still have been open at the candle you are viewing.
Change the configuration and the map changes with it. If a trade would already have reached TP, SL or break-even by that candle, it is no longer shown as Golden.
Compare different approaches on the same market and the same historical data.