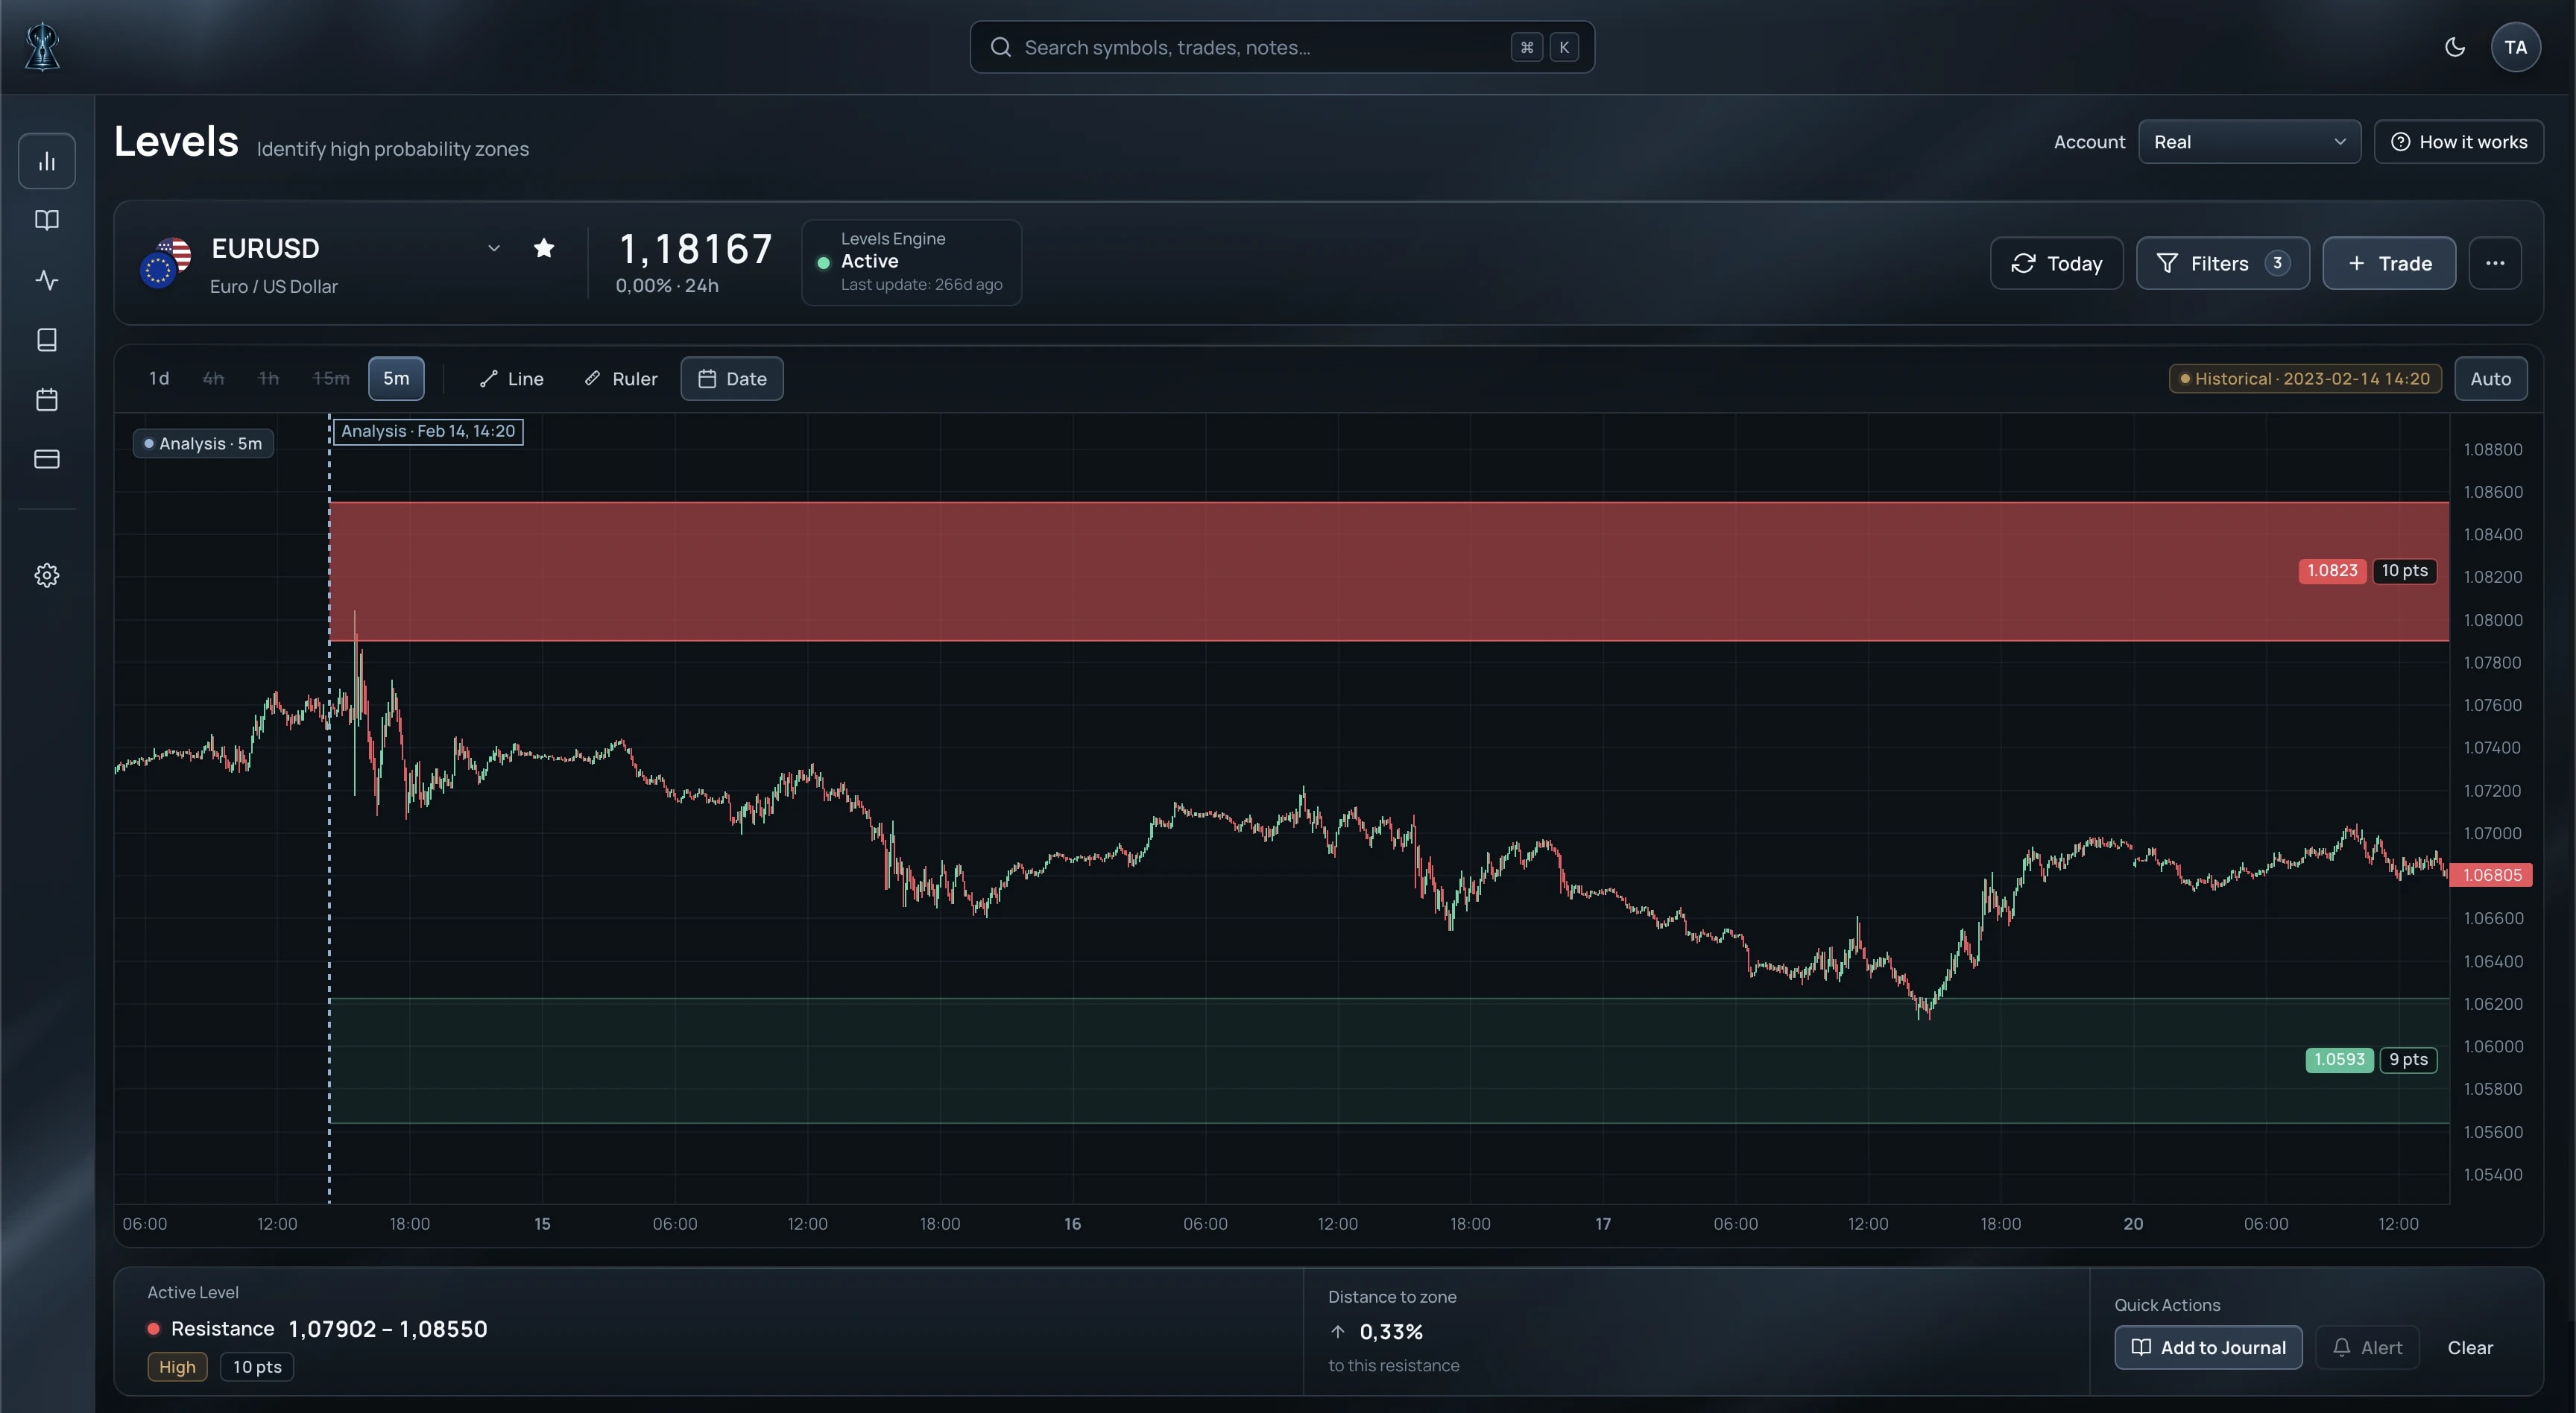


See the chart like you know something the market doesn't.
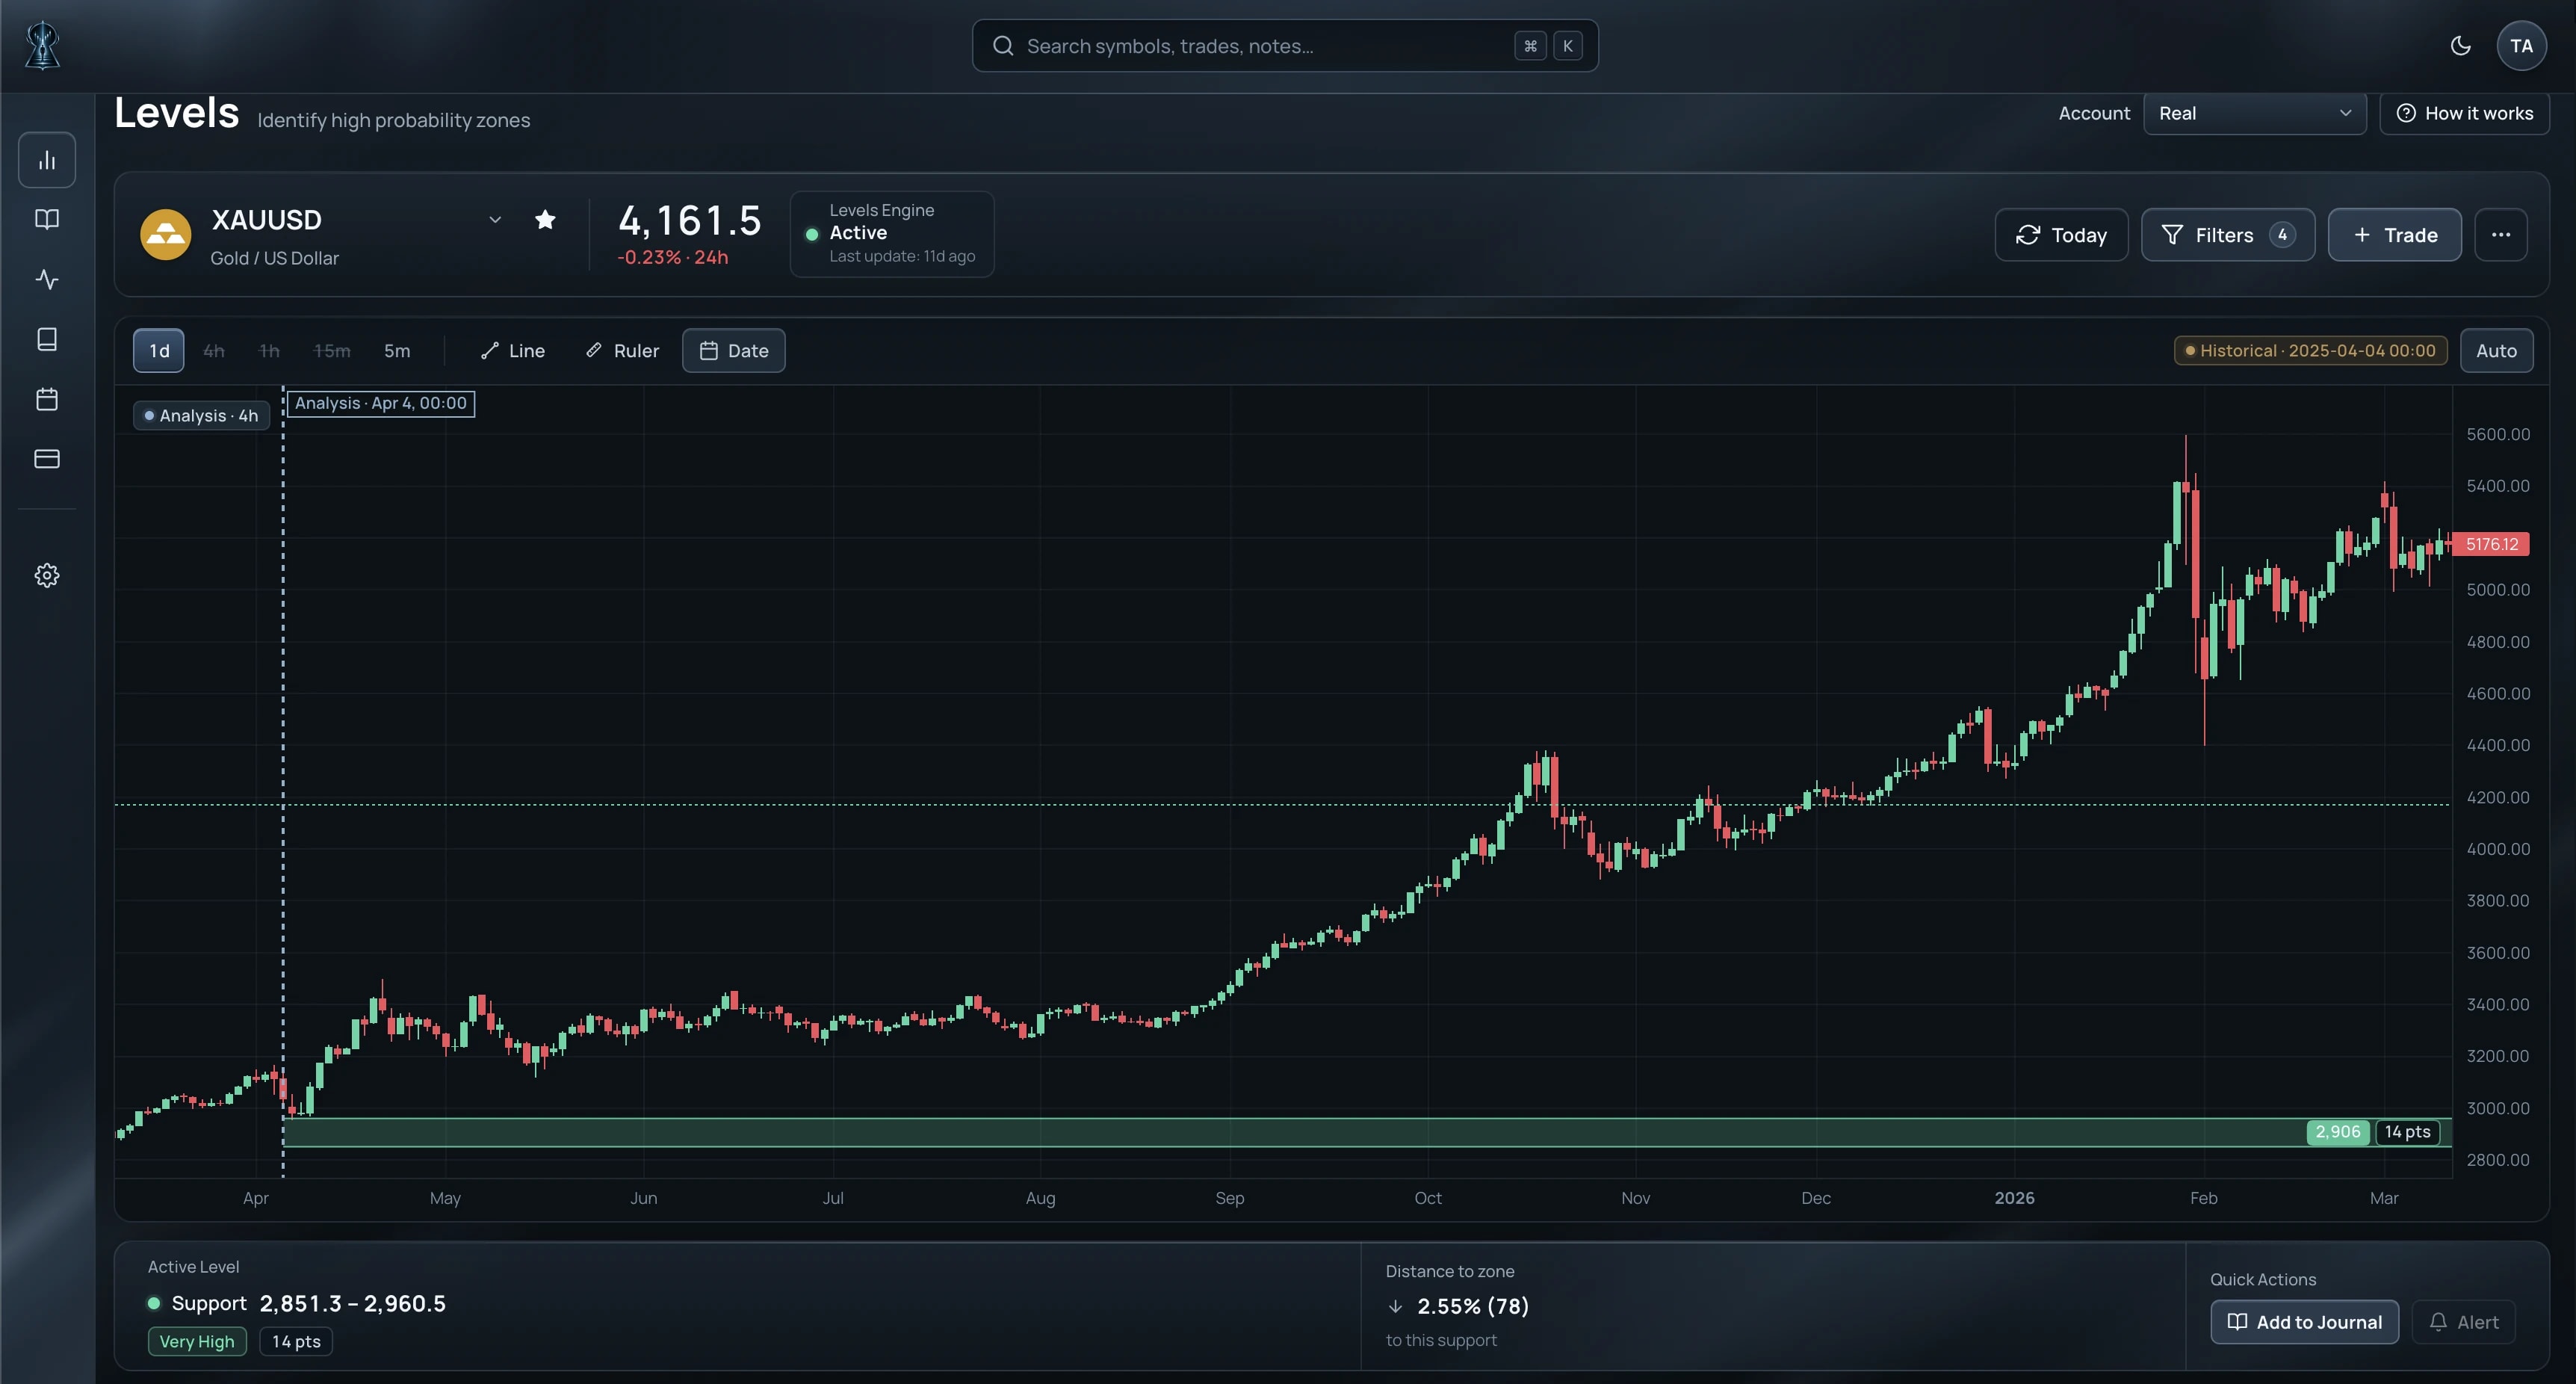
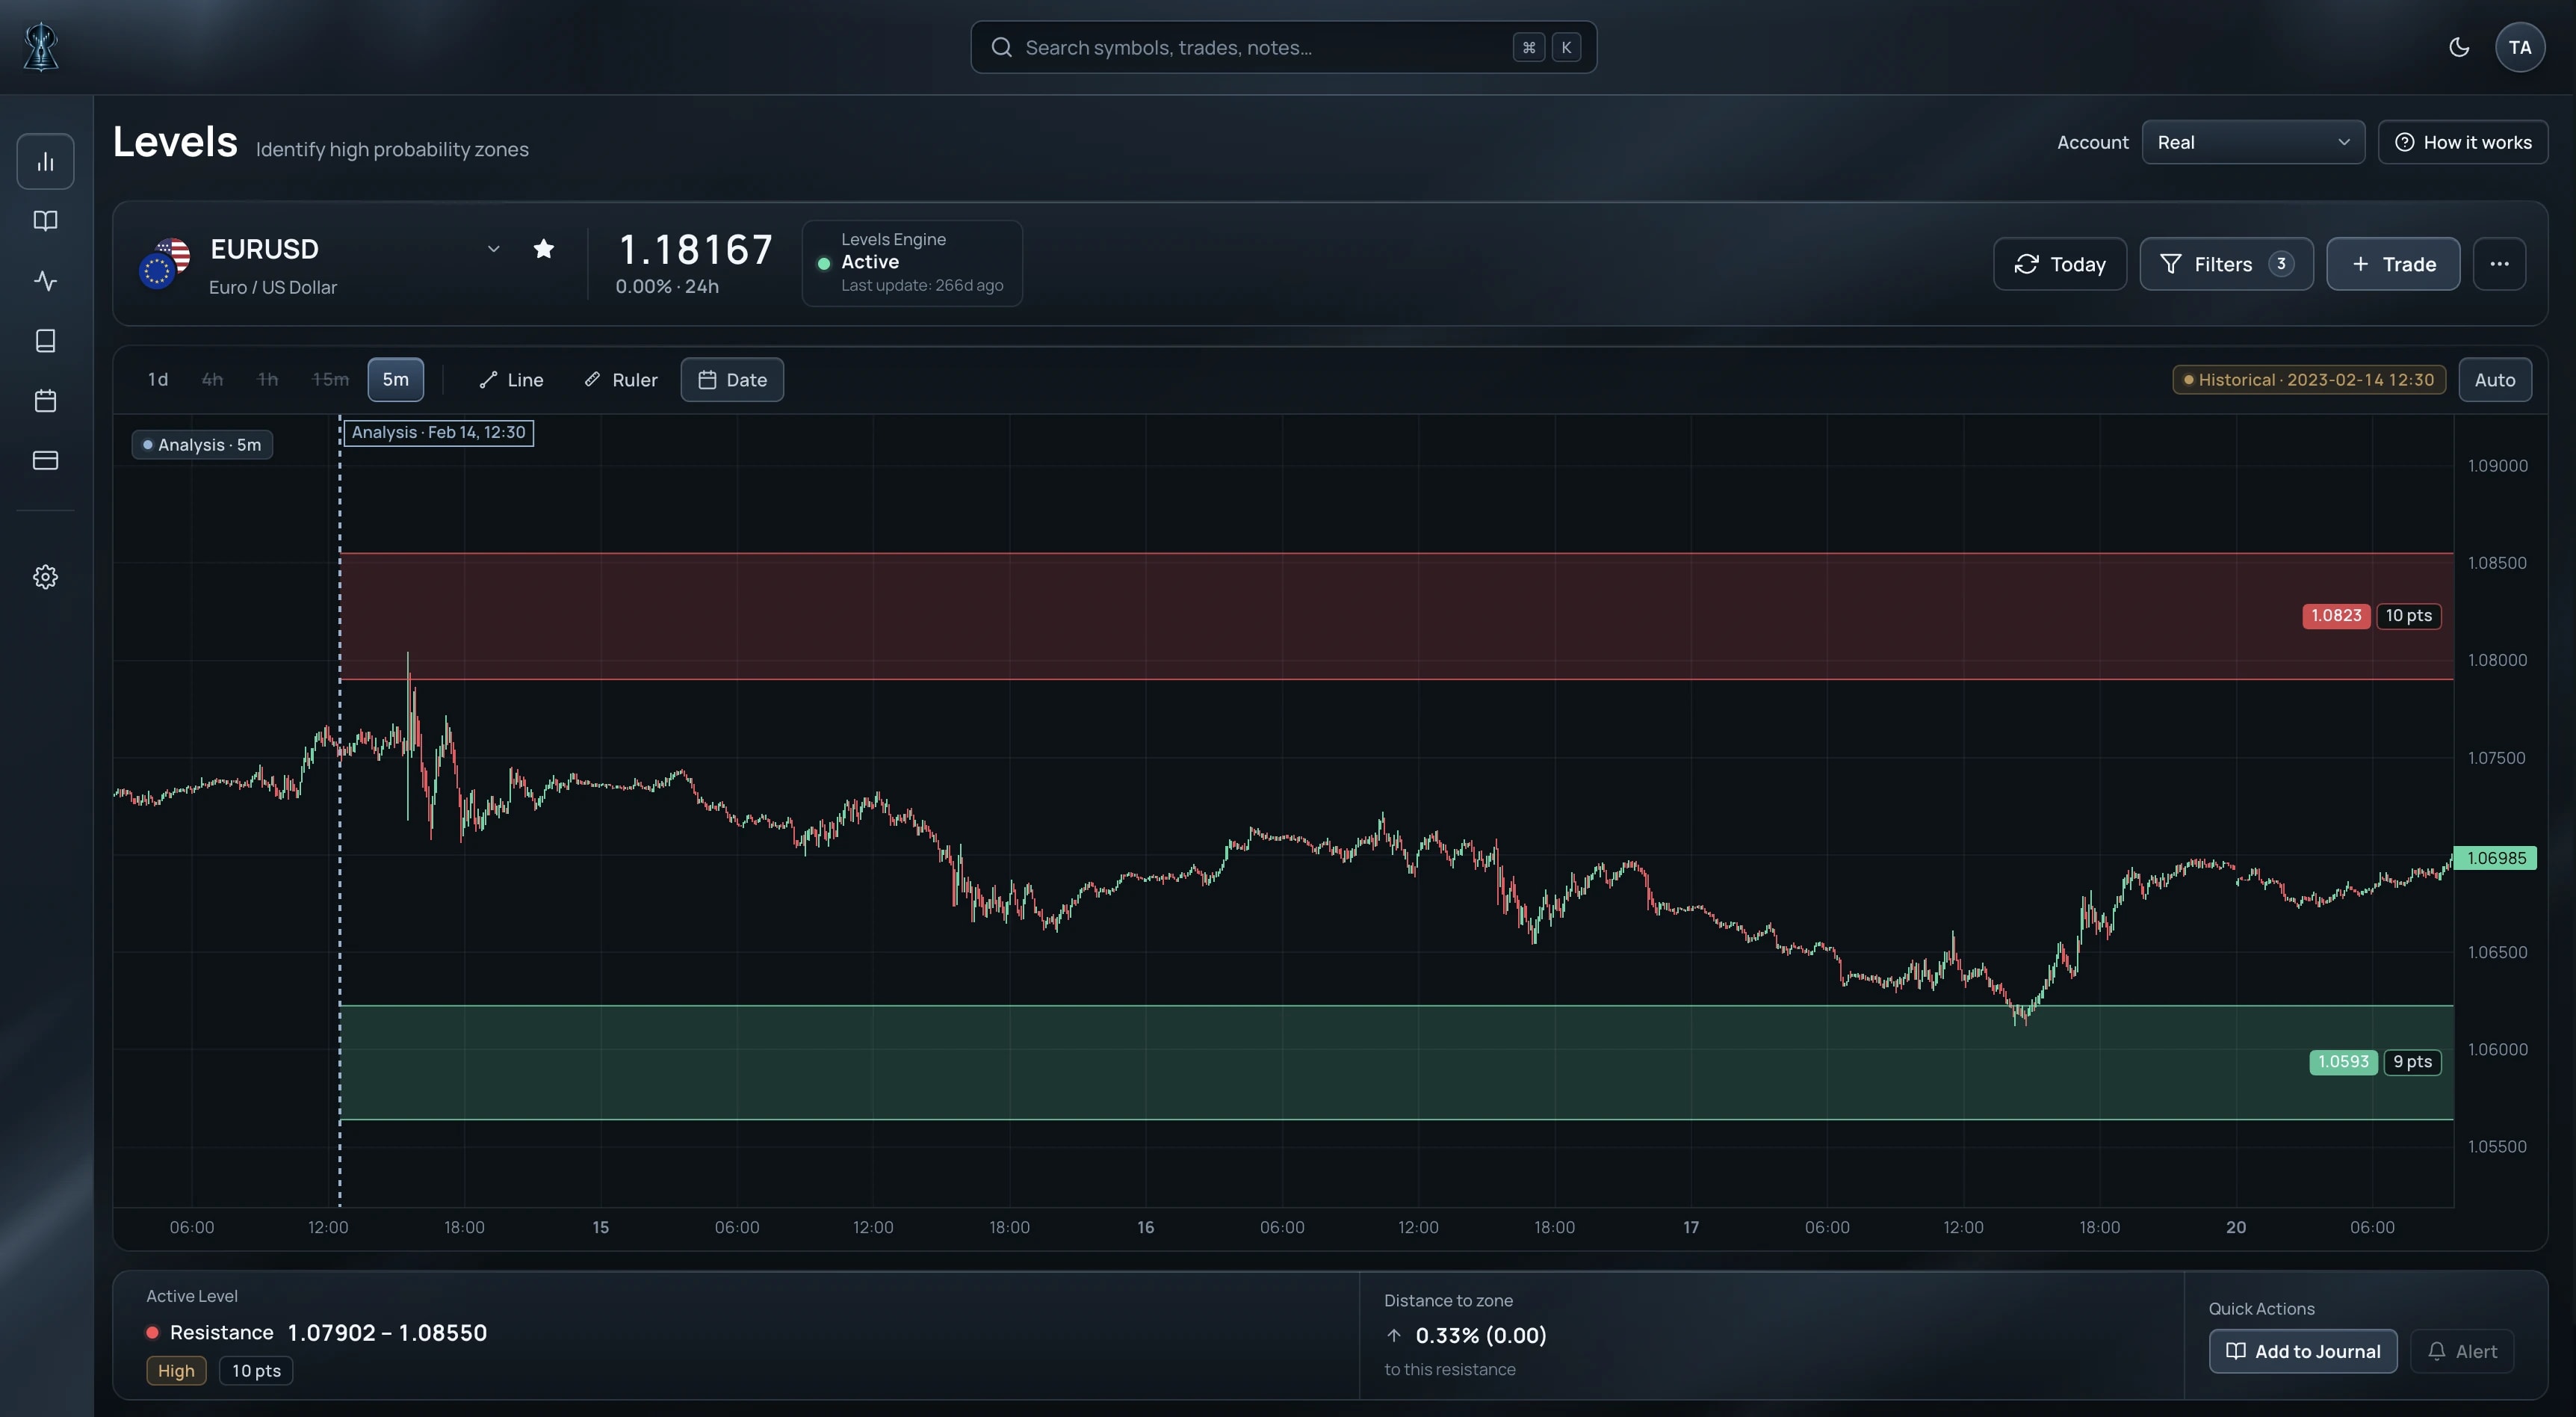
Secret Levels maps support and resistance zones you won't find anywhere else, showing where the market is most likely to turn before price gets there.
Each Level includes a strength score, so you can quickly identify the strongest zones.
Access is opening progressively.
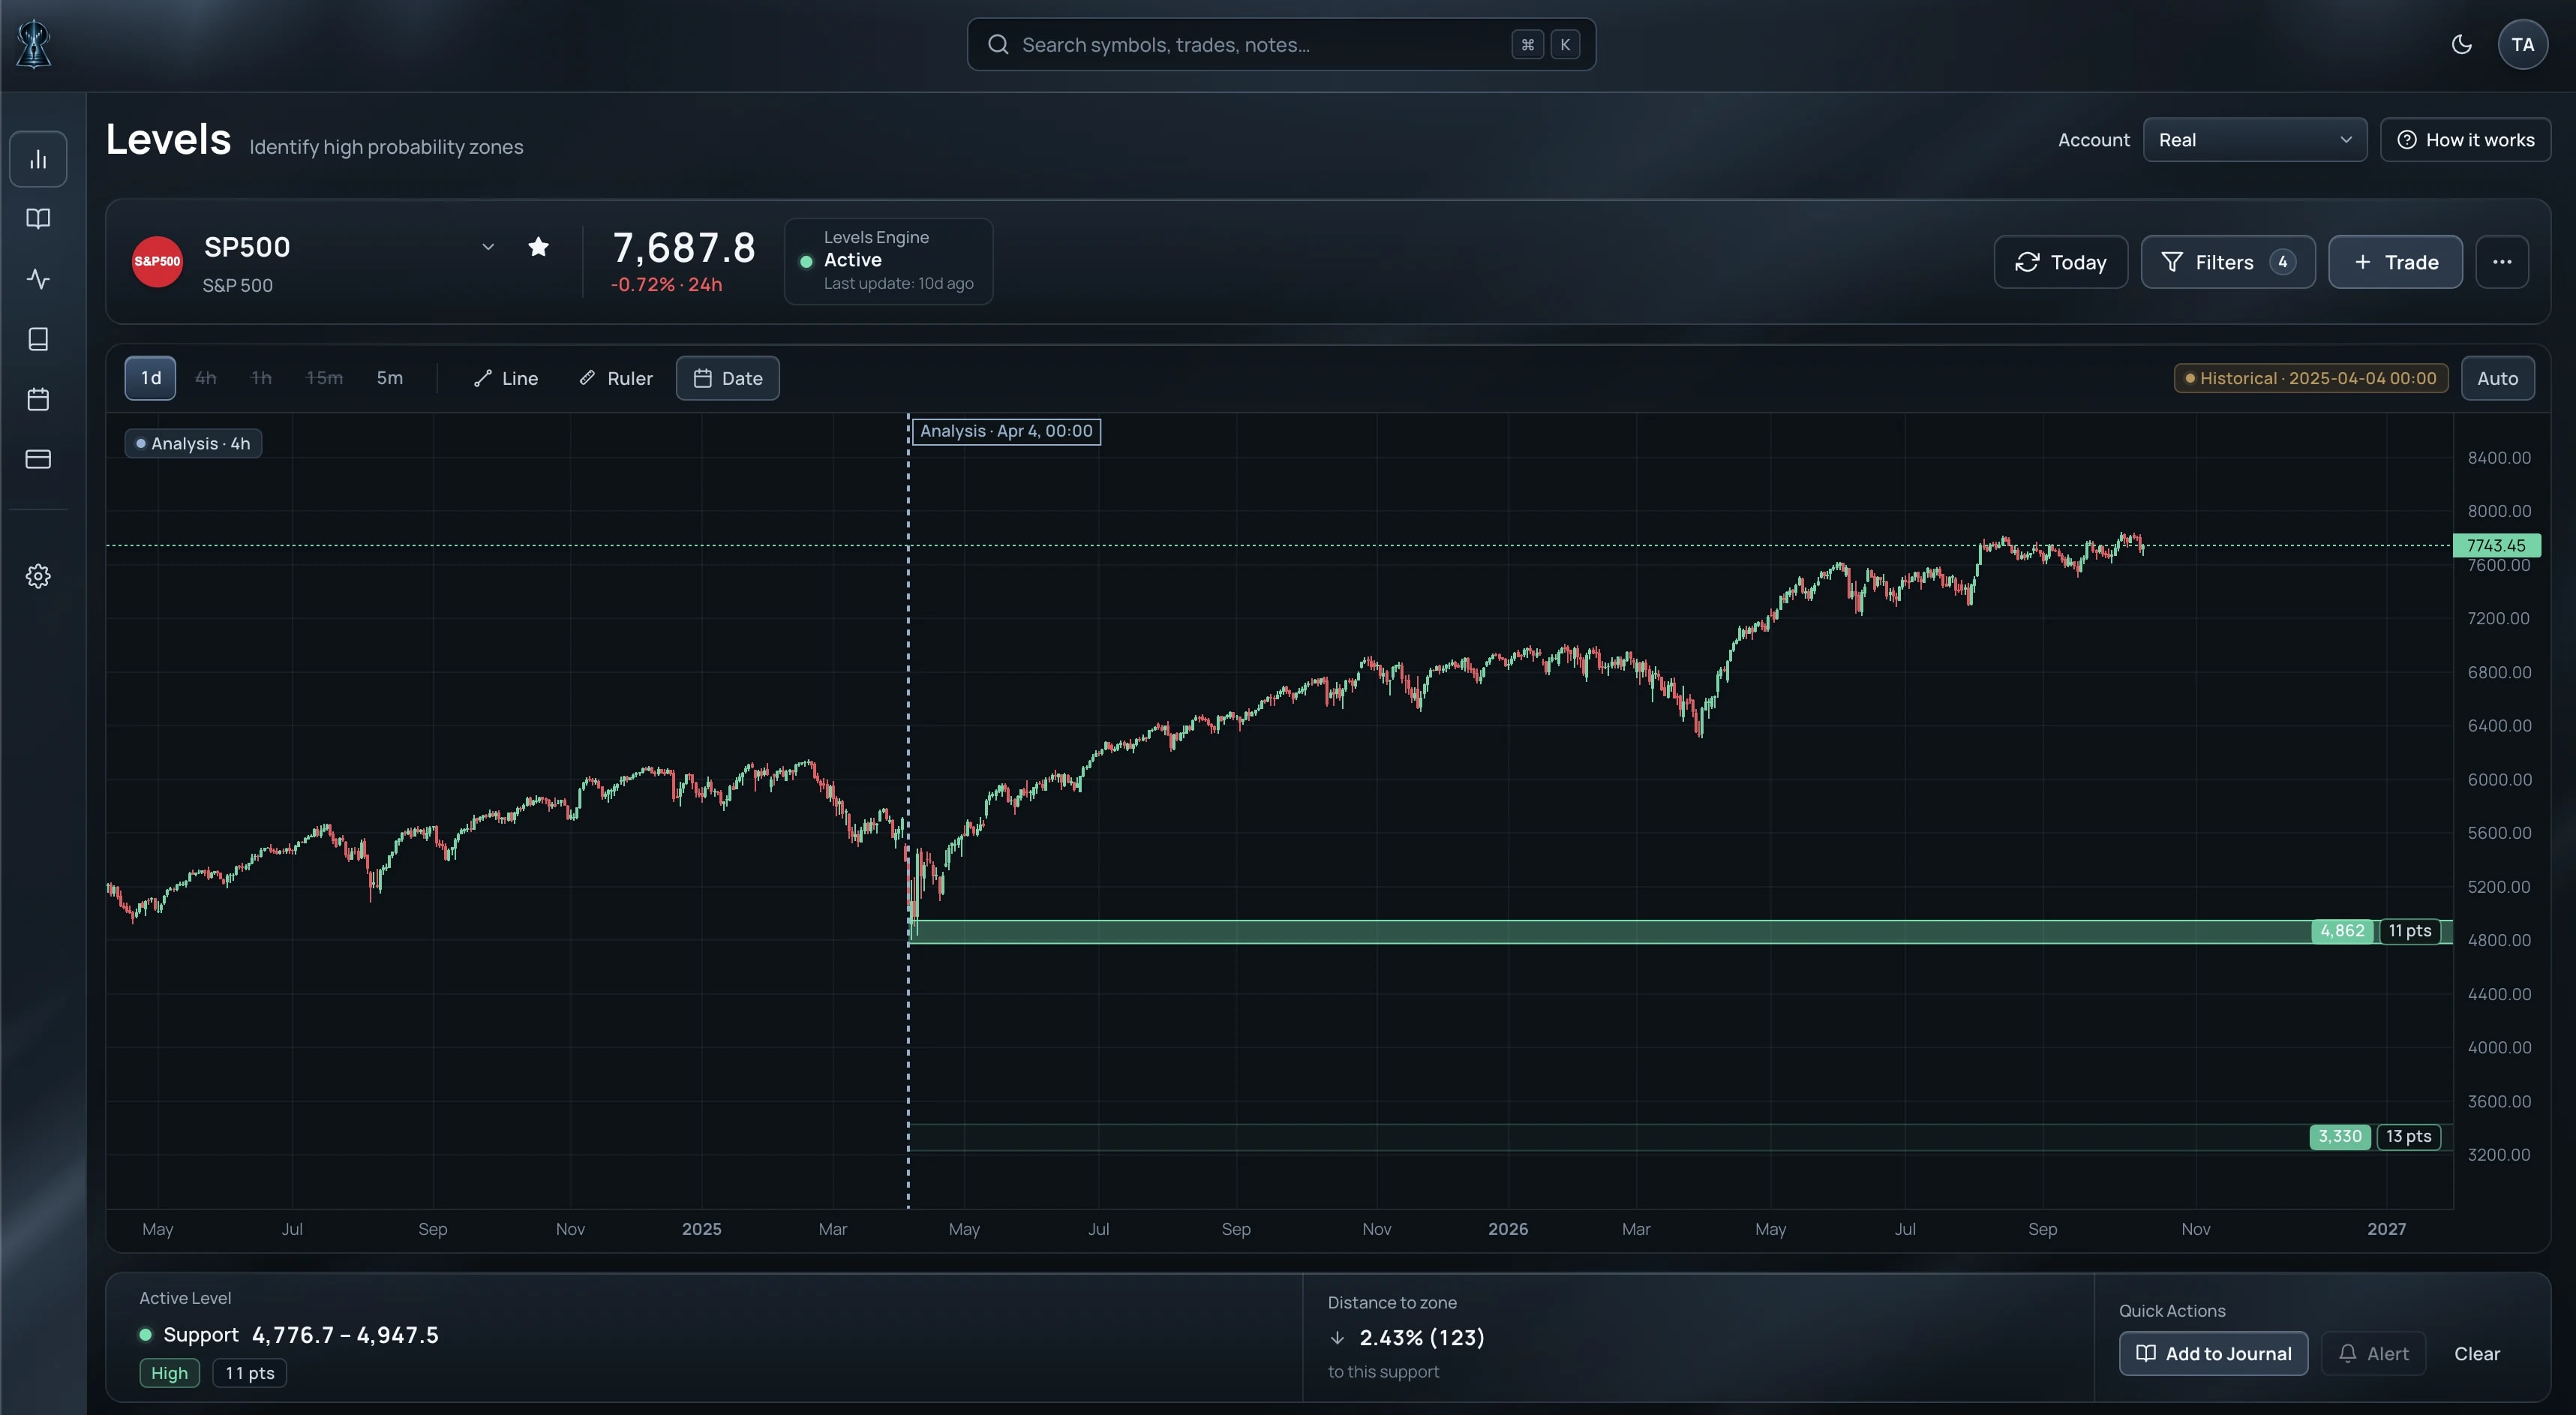
Go back. Check the Levels yourself.
- Pick any candle in the past and see the Levels that were visible at that exact moment.
- No future data. No Levels plotted in hindsight.
- Apply your own take-profit, break-even and stop-loss rules to the same historical view.
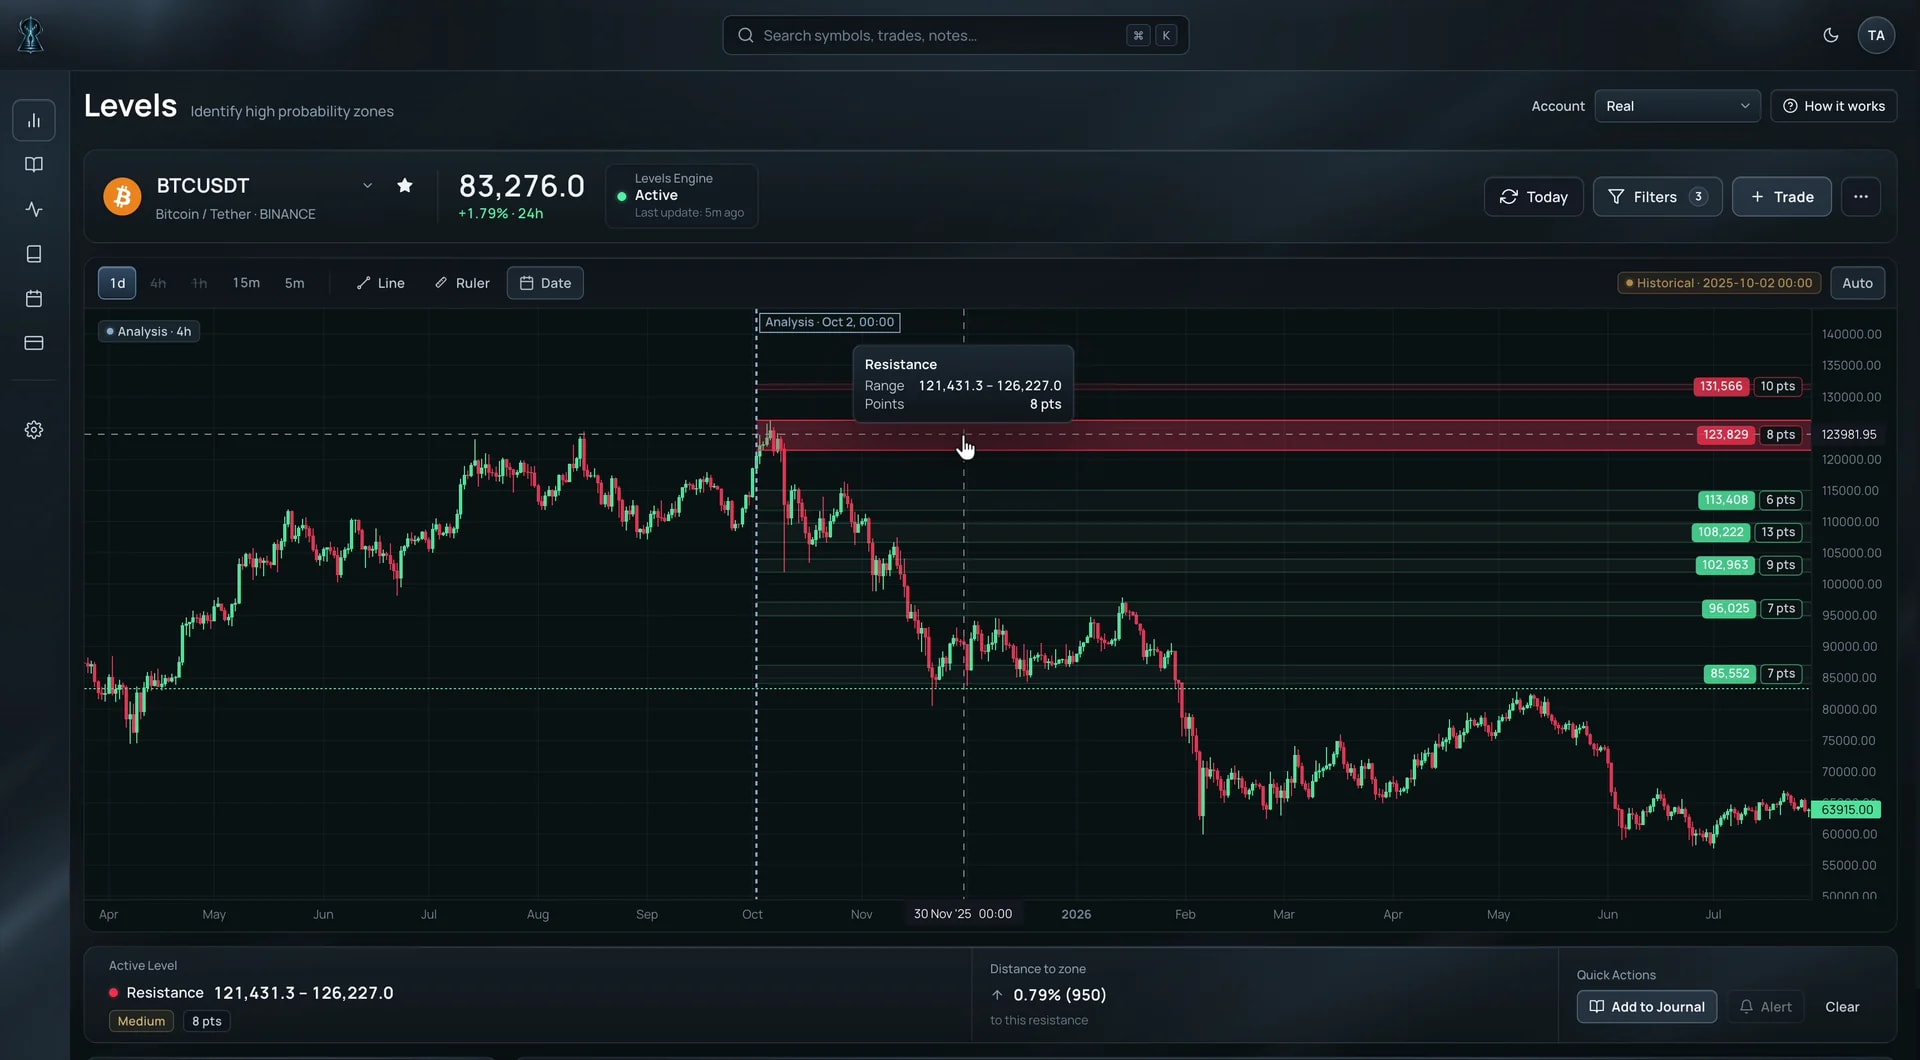
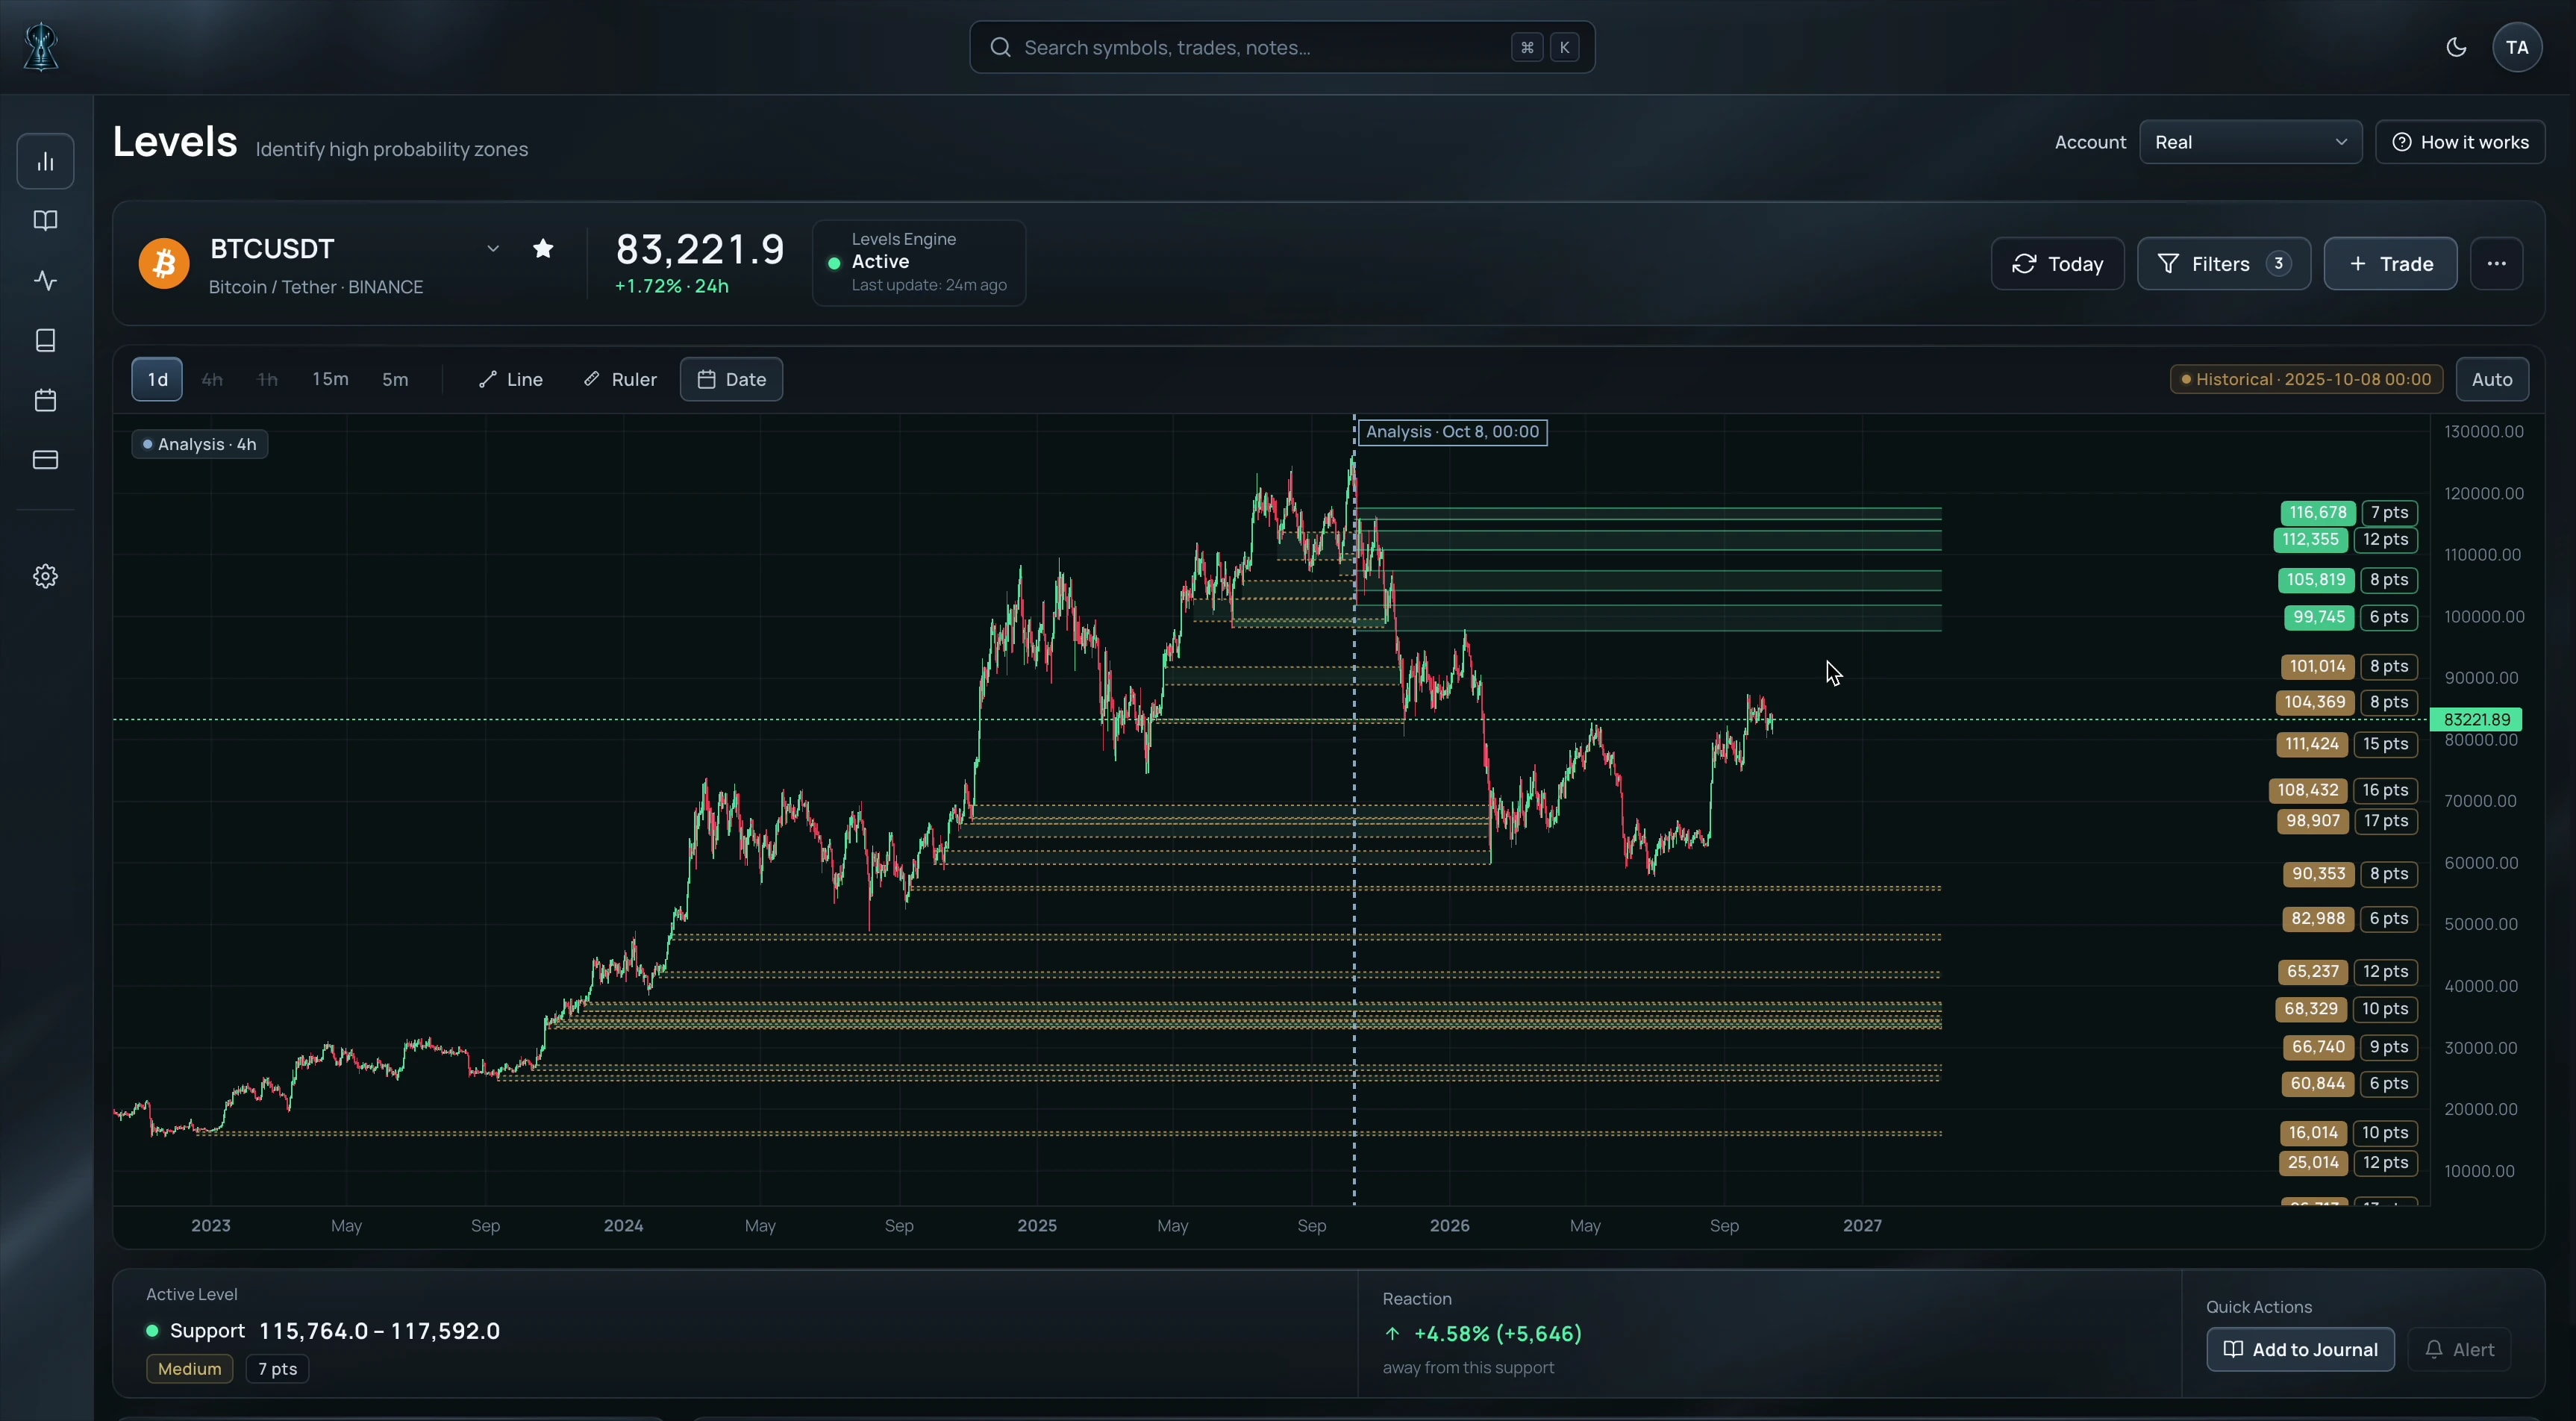
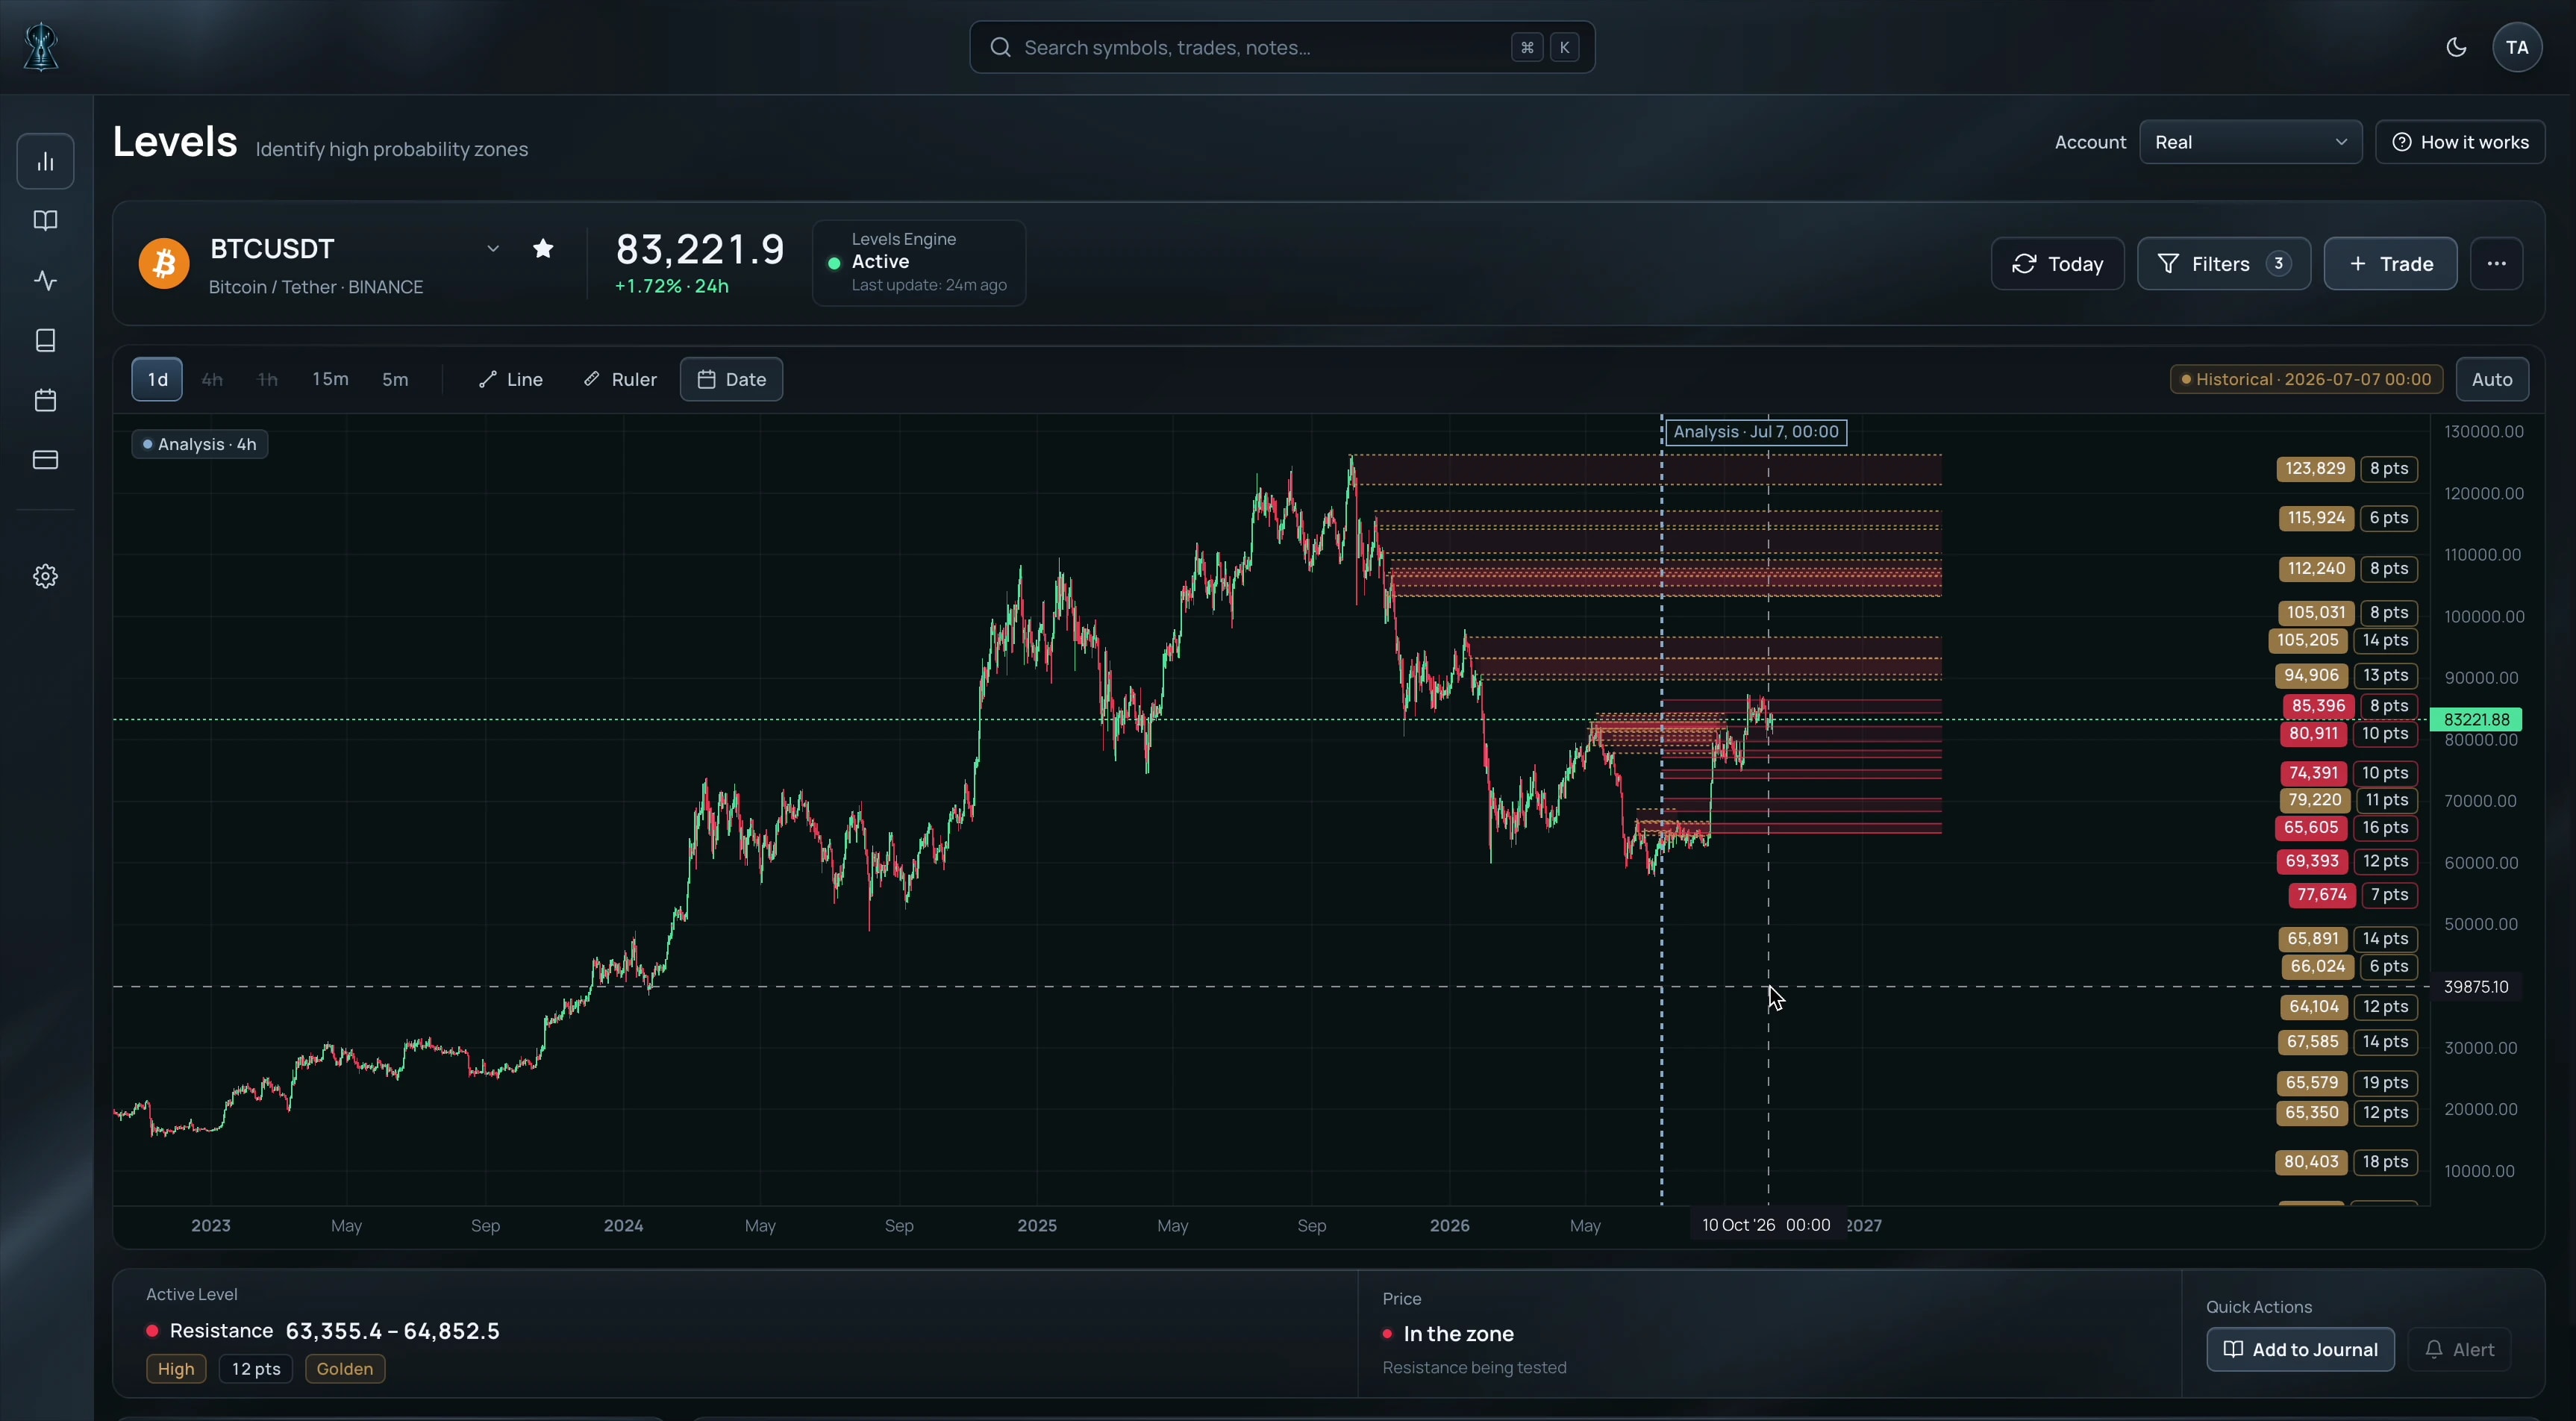
Secret Levels doesn't just show you where liquidity is concentrated. It shows you how the opportunity can be traded.
A single Level can reveal an opportunity. Clusters of Levels can show where liquidity is building and where price may have more room to travel.
BTCUSDT · Daily
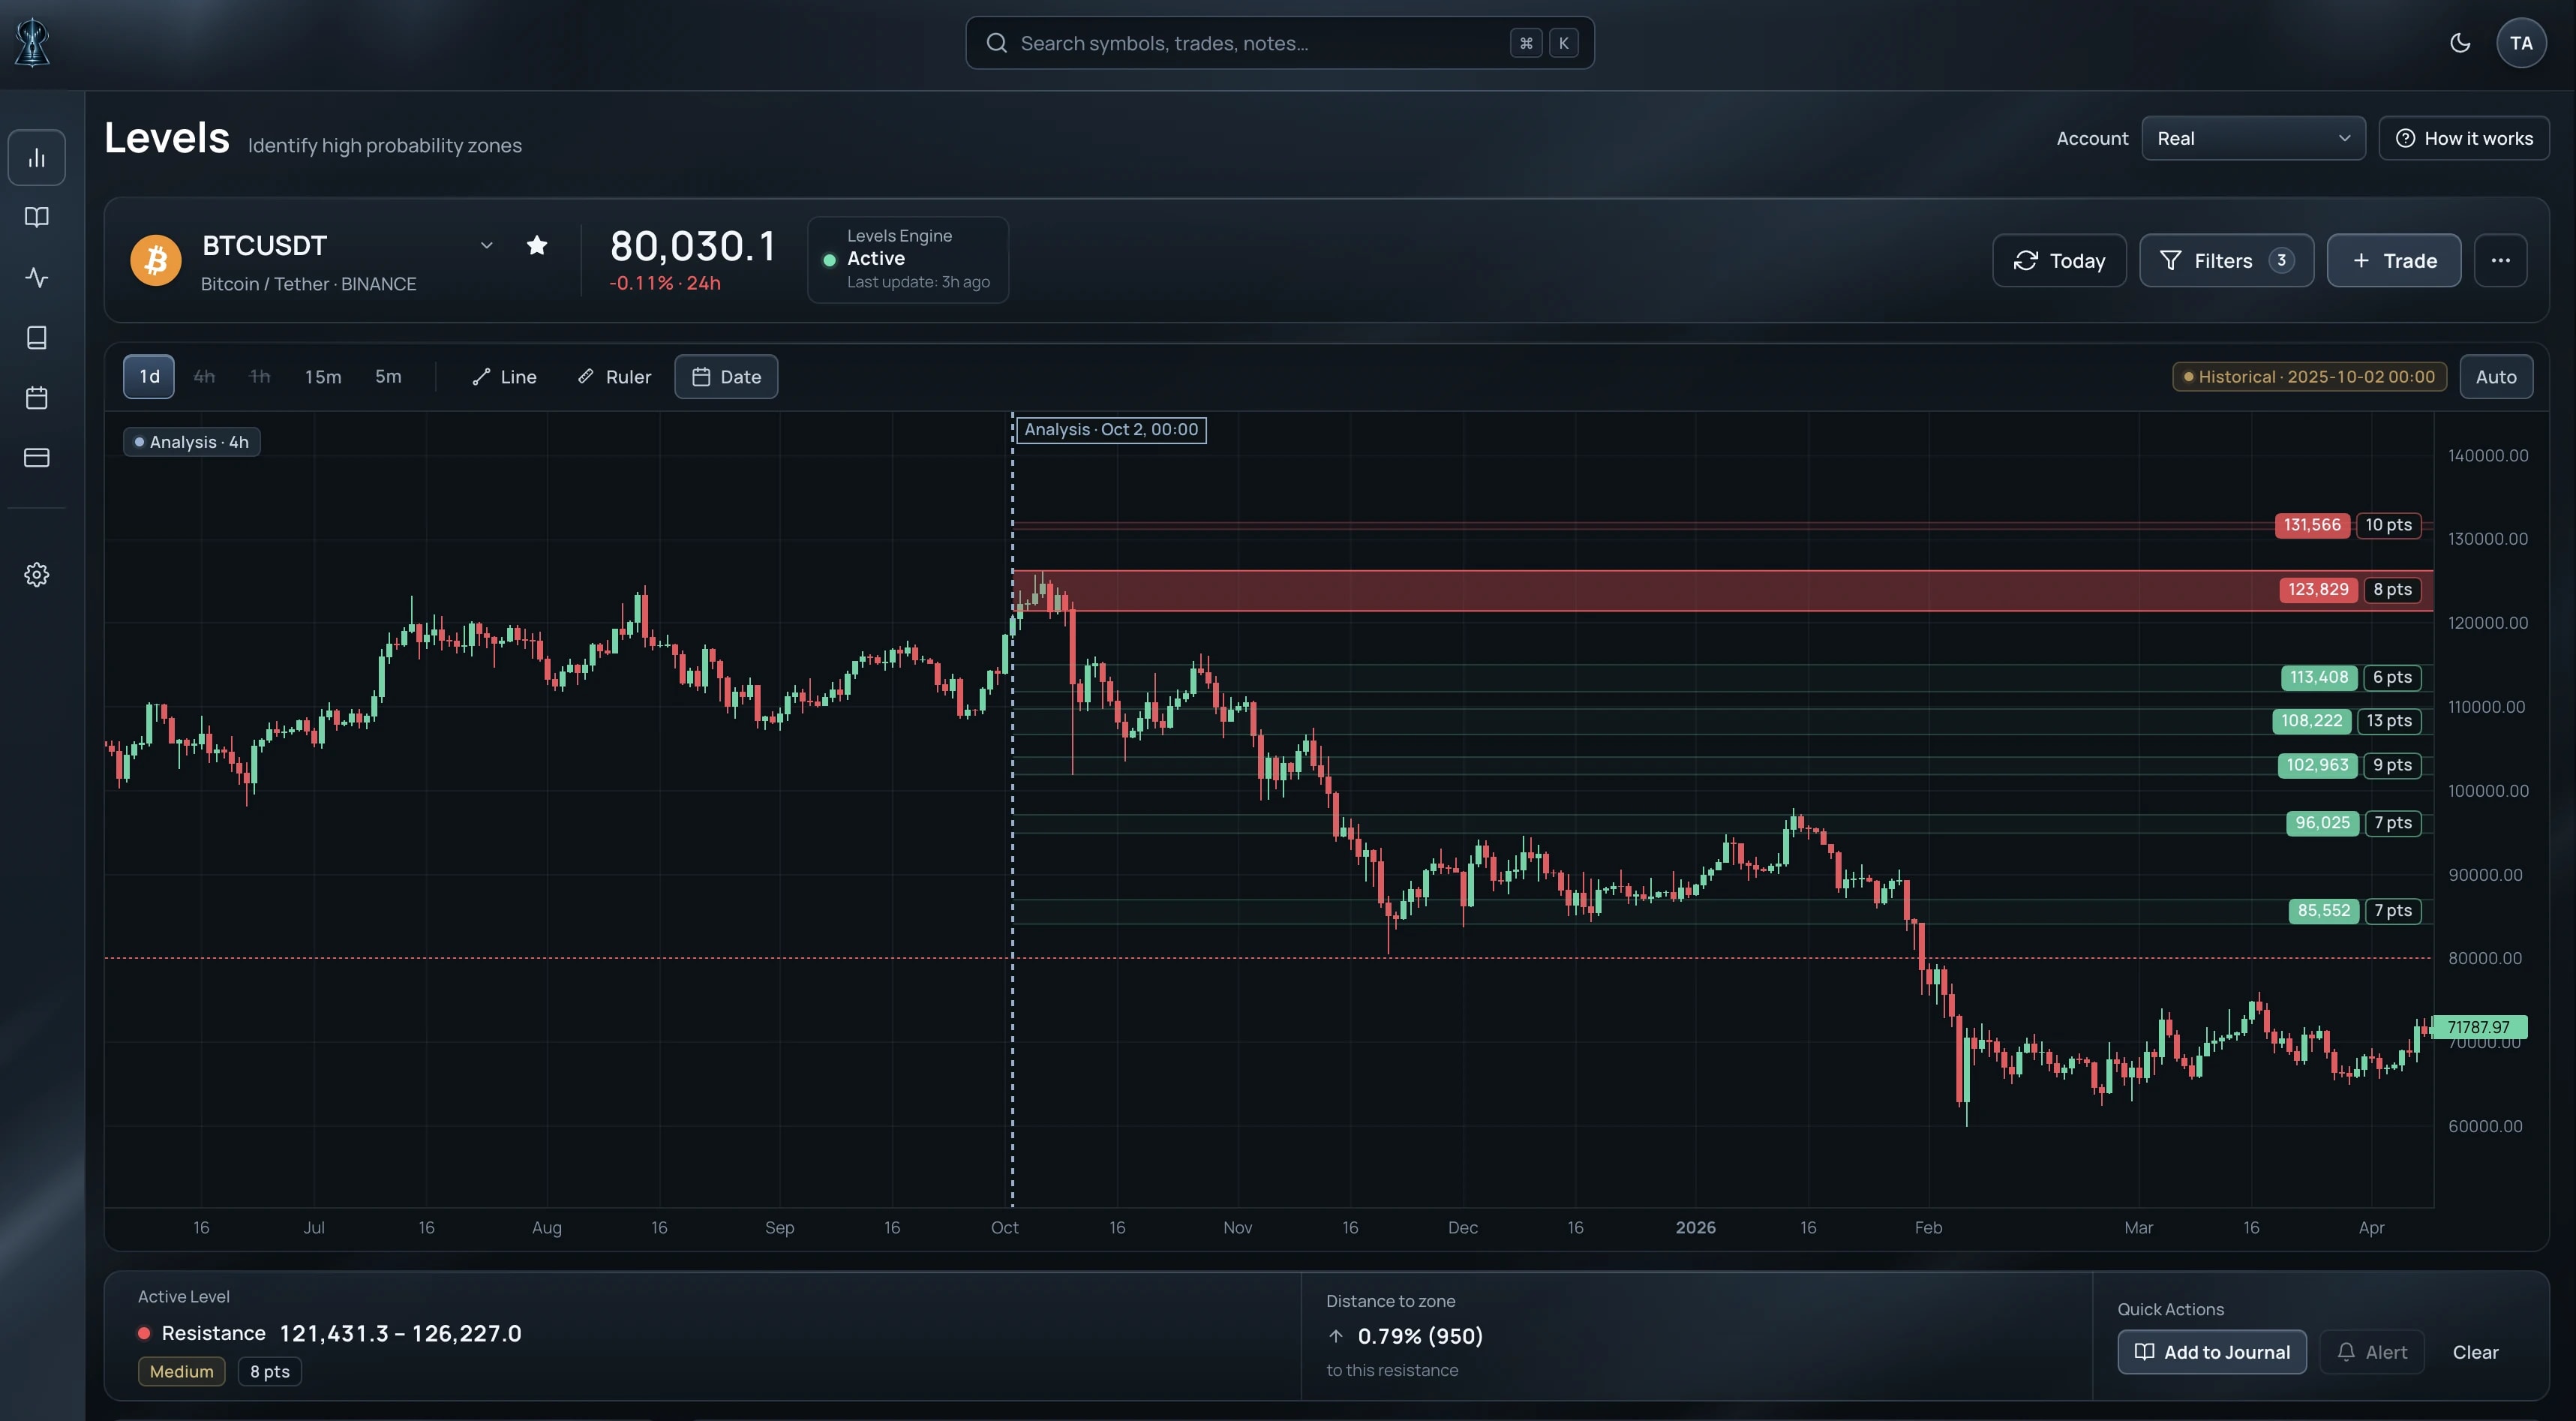
One system across the markets and timeframes you trade.
Move from higher-timeframe investment decisions to lower-timeframe trading entries, or combine both when you want tighter risk inside a much larger move.
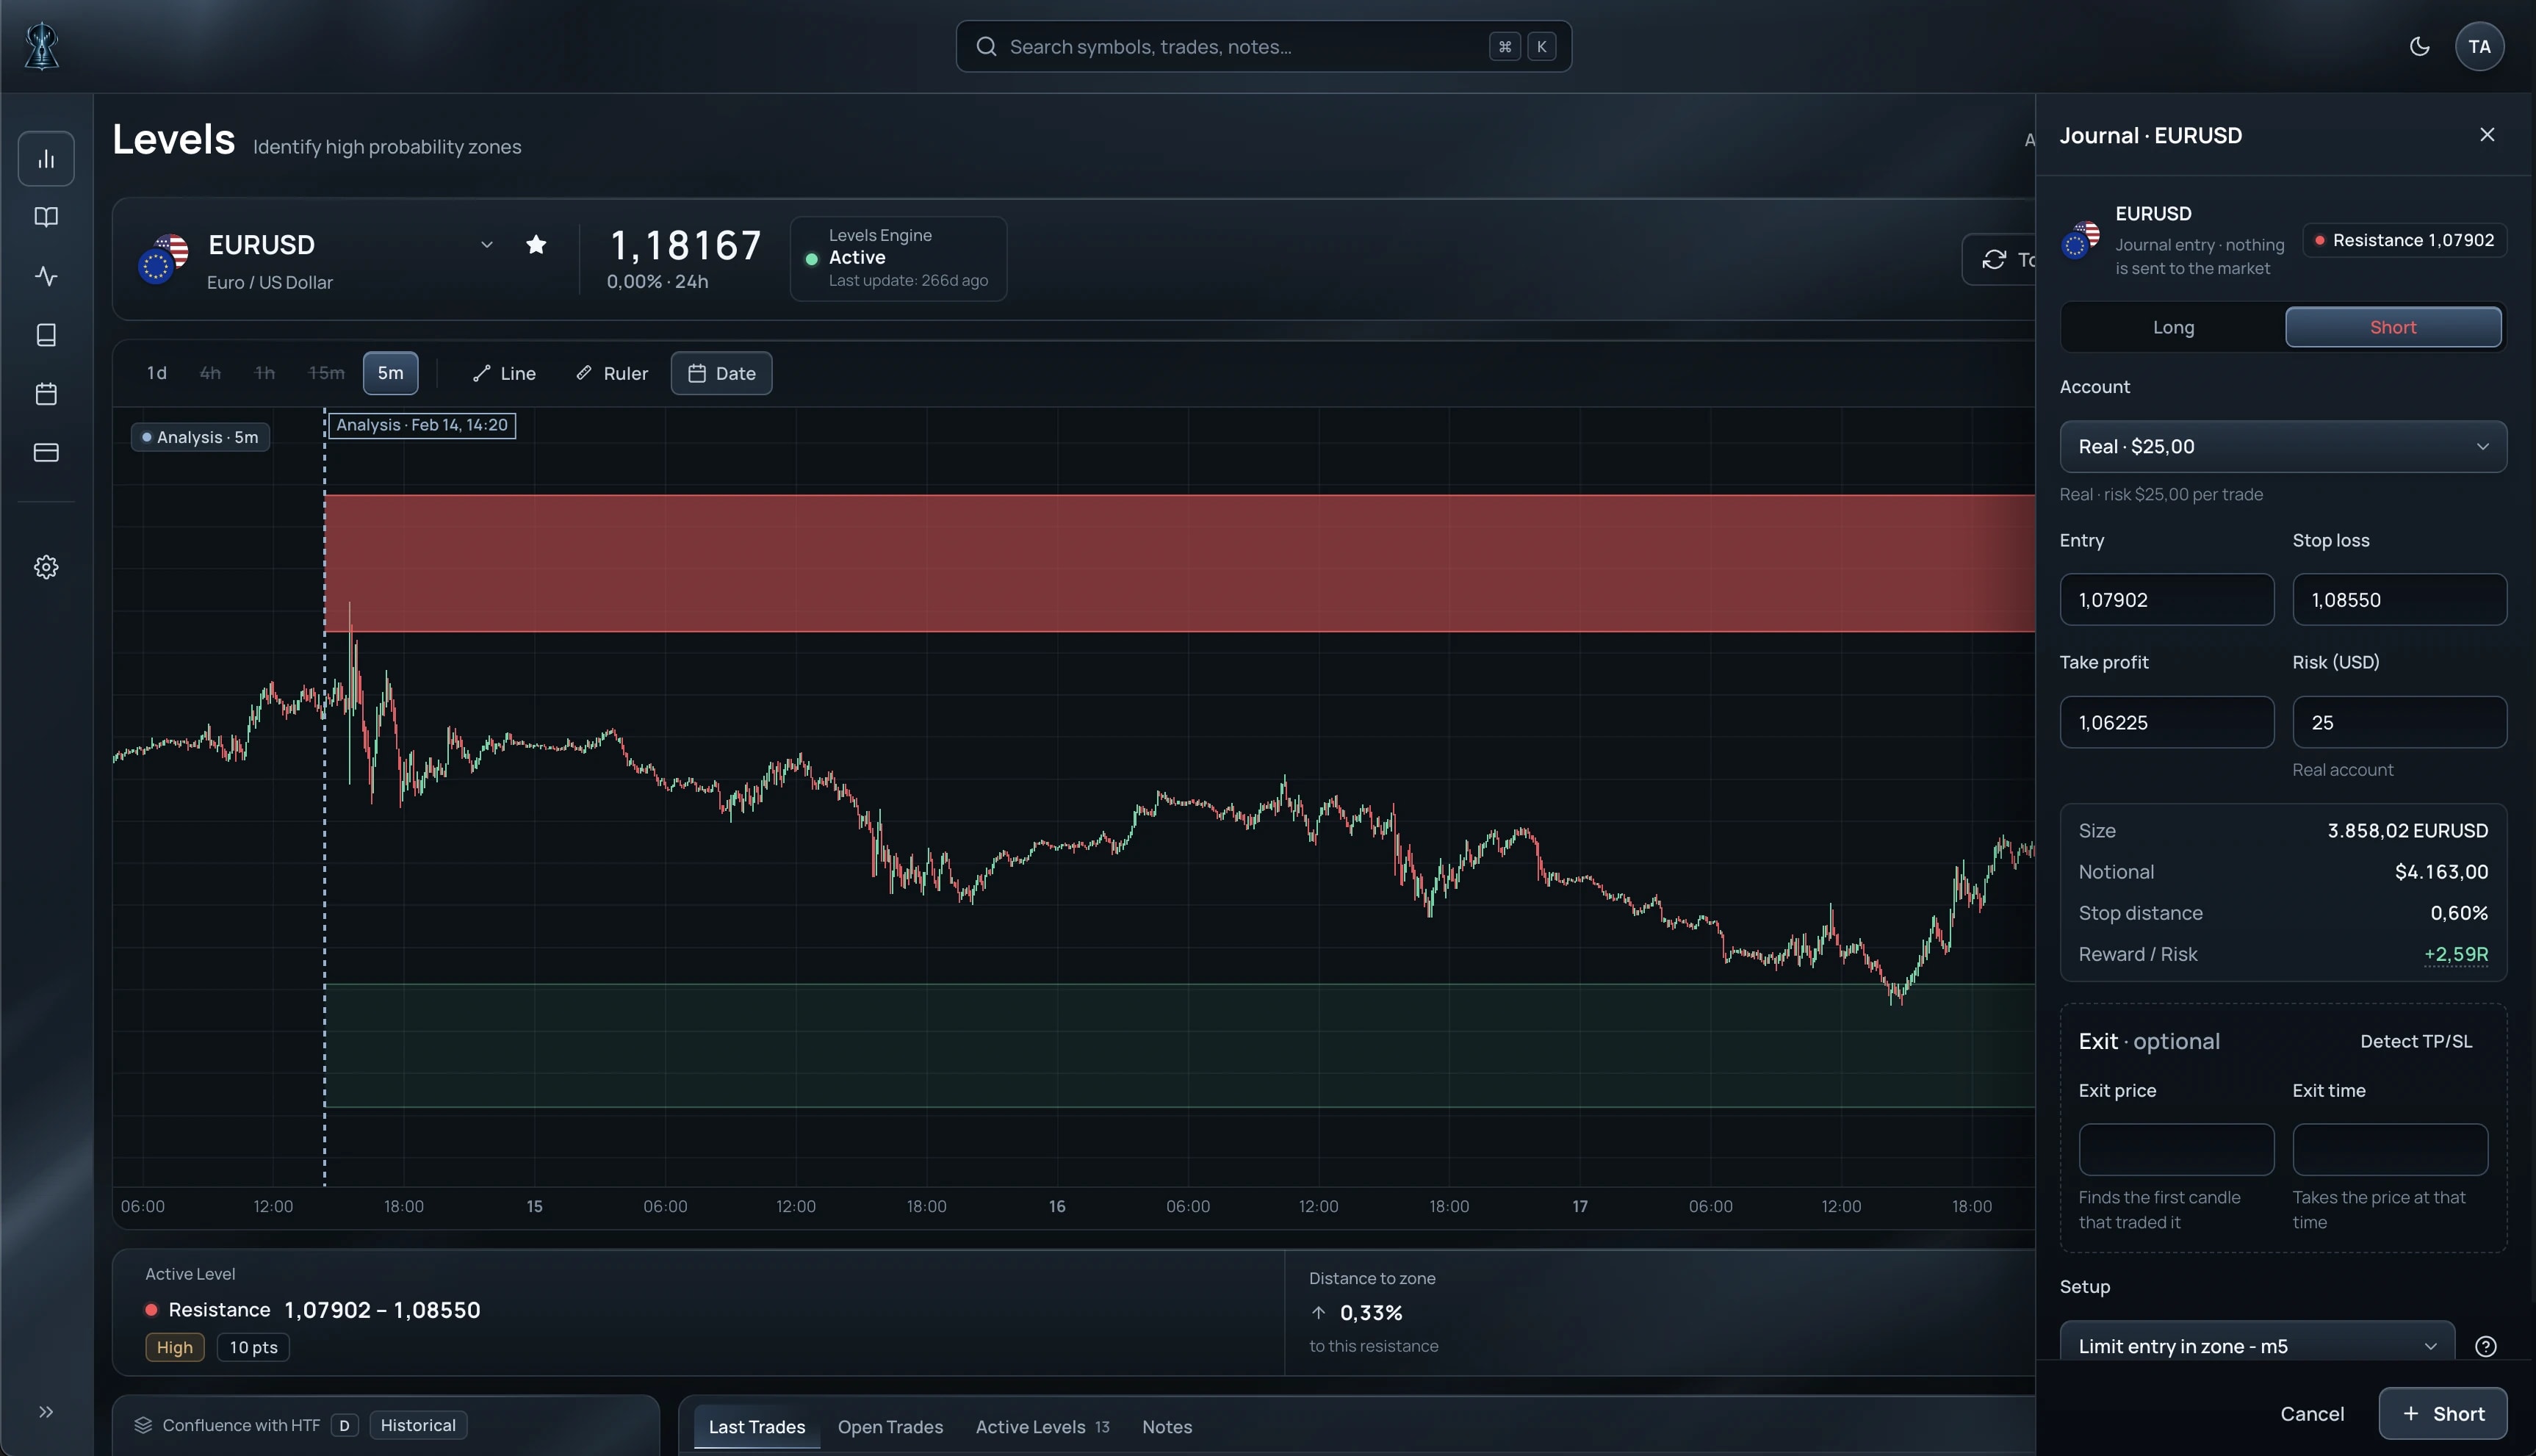
Turn the Level into a trade without leaving the chart.
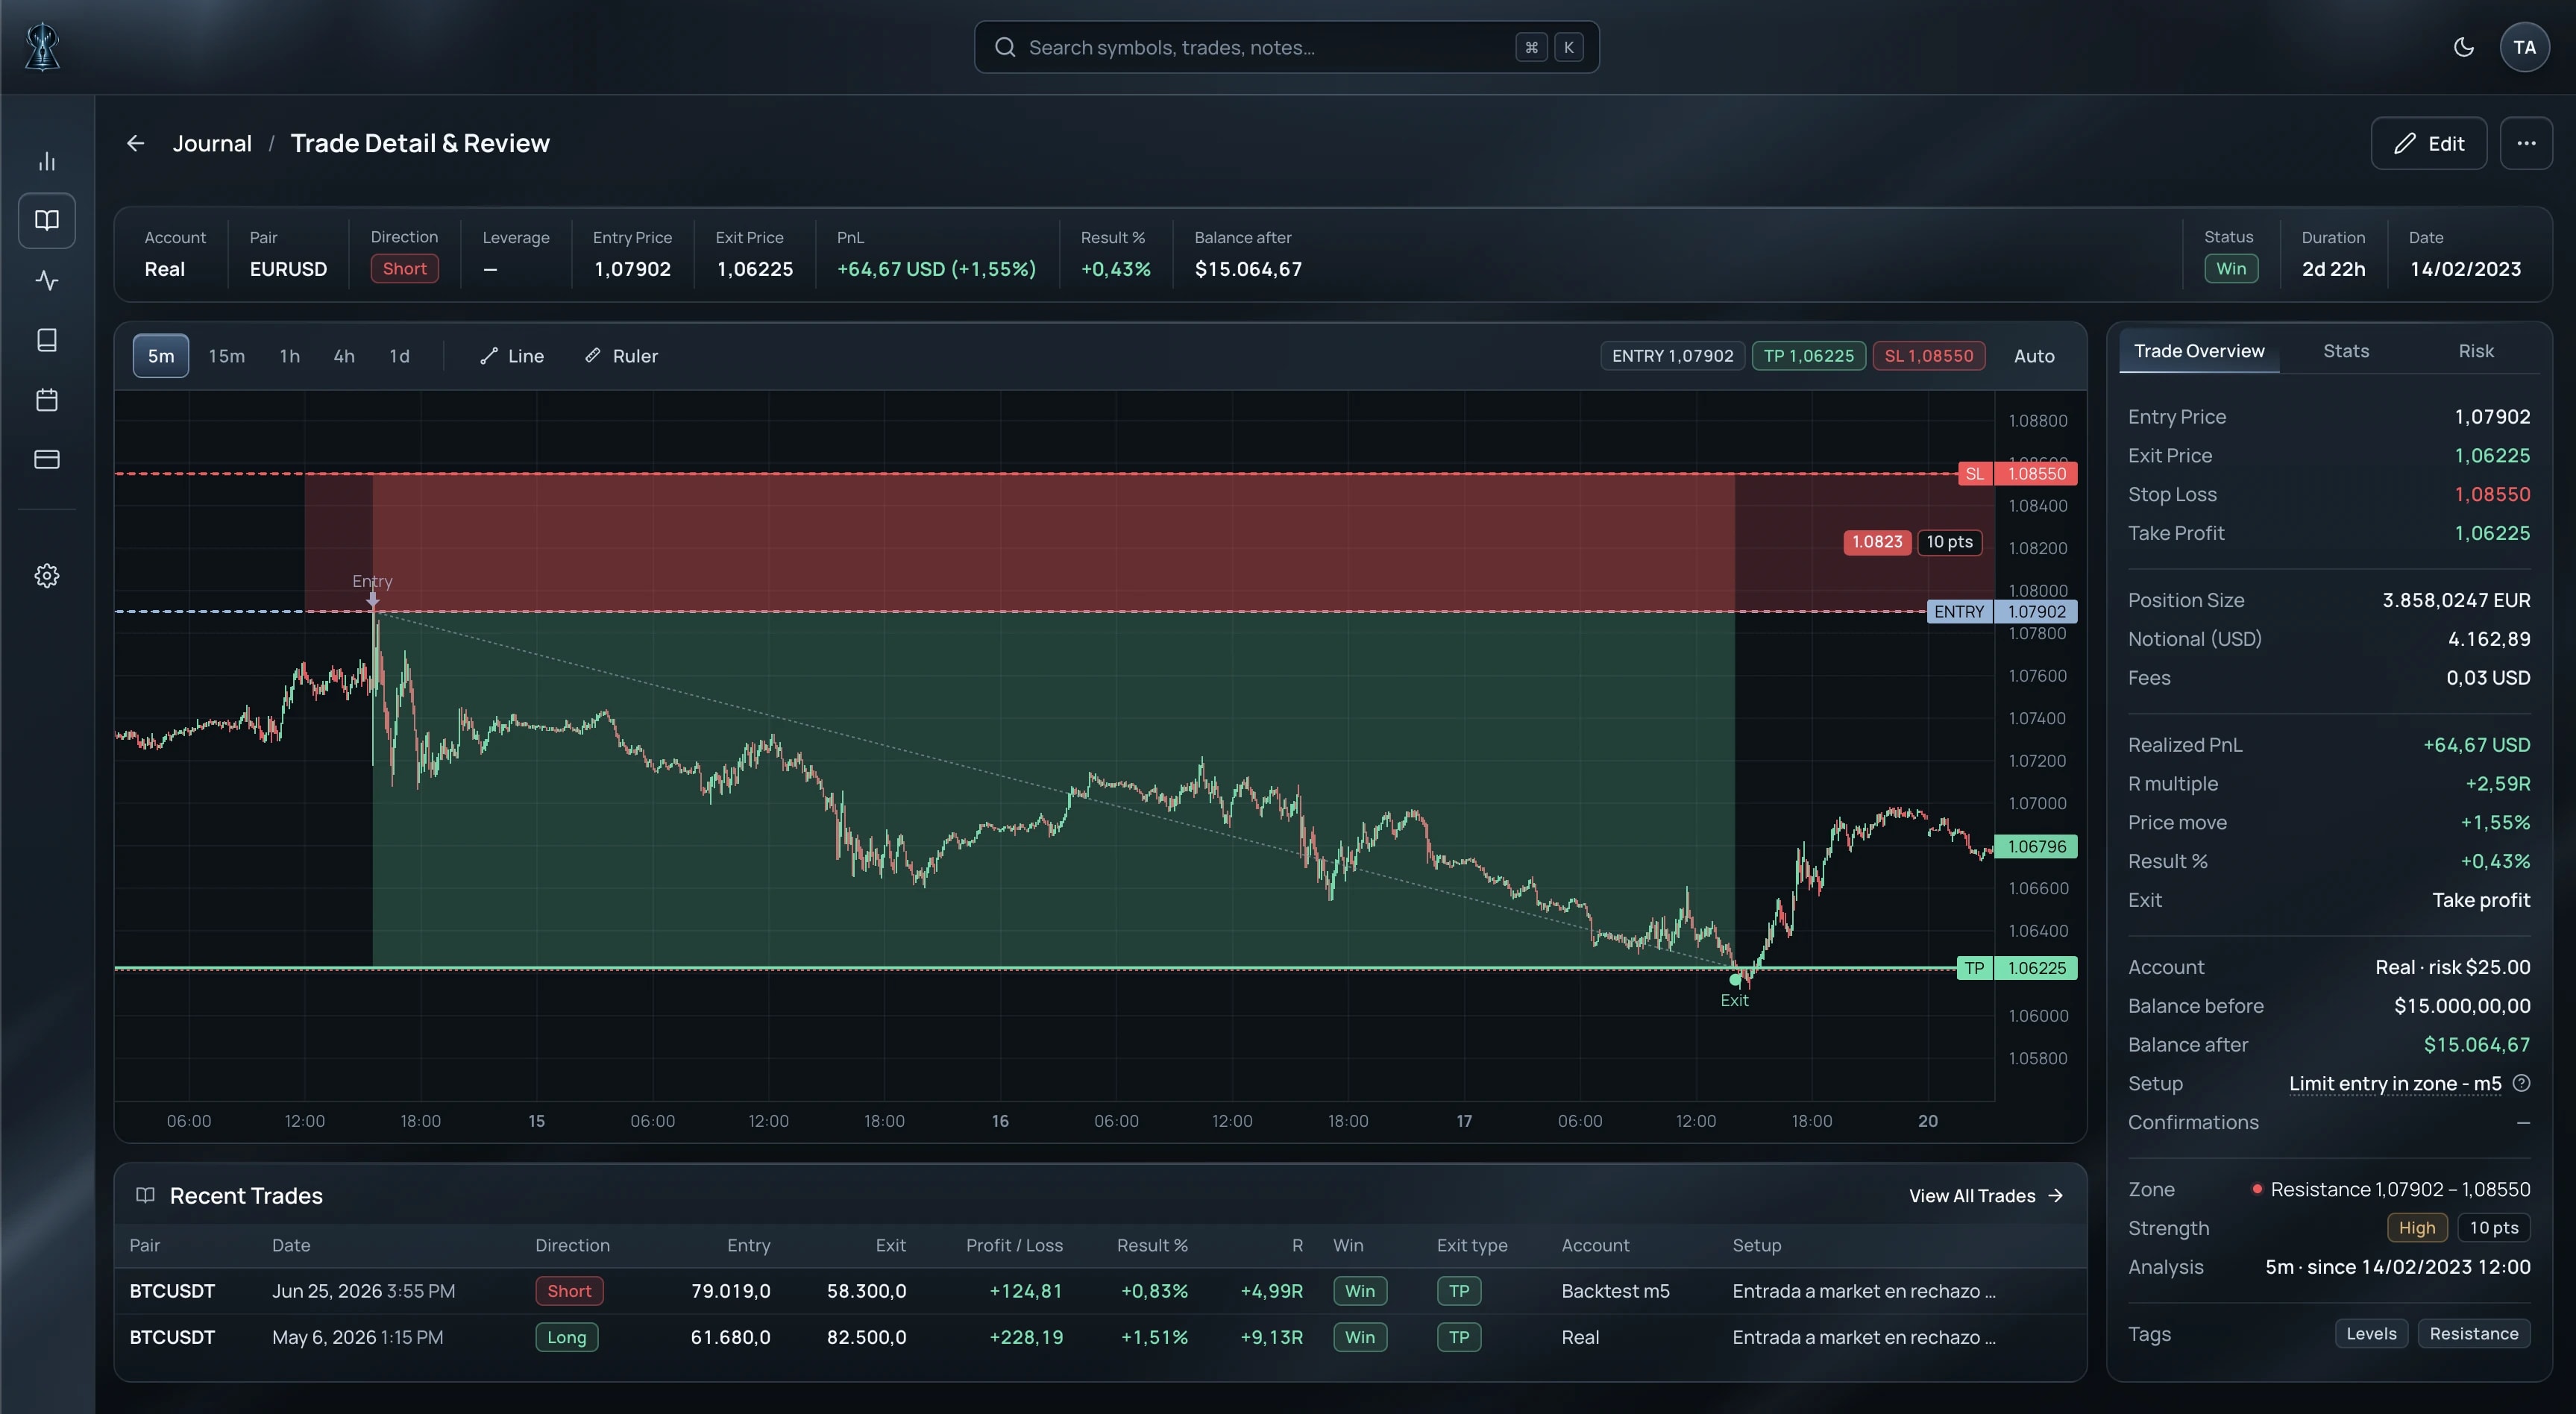
Select a zone, create the trade, and adjust the entry, stop or target. Every trade stays connected to your journal and performance analytics.